
Fig. 2
- ID
- ZDB-FIG-230207-23
- Publication
- Nair et al., 2021 - A permissive epigenetic landscape facilitates distinct transcriptional signatures of activating transcription factor 6 in the liver
- Other Figures
- All Figure Page
- Back to All Figure Page
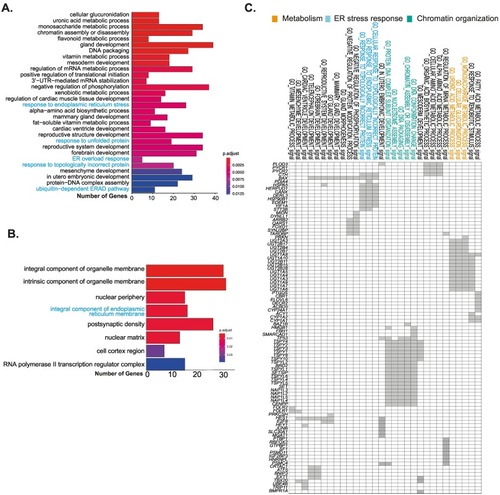
CPATs are involved in proteostasis, small molecule metabolism and development (A) Gene Ontology (GO) based biological process enrichment analysis of top 25 terms in putative Atf6 targets; terms related to proteostasis highlighted in blue (B) GO cellular component analysis: terms related to ER highlighted in blue. (C) Geneset enrichment Leading Edge analysis highlights the groups of genes driving a particular function. Grey boxes mark the genes representing each GO term. Highlighted in blue are proteostasis, orange are small molecule metabolism and green are DNA packing related GO terms. (For interpretation of the references to colour in this figure legend, the reader is referred to the web version of this article.) |