
|
Fig. 6
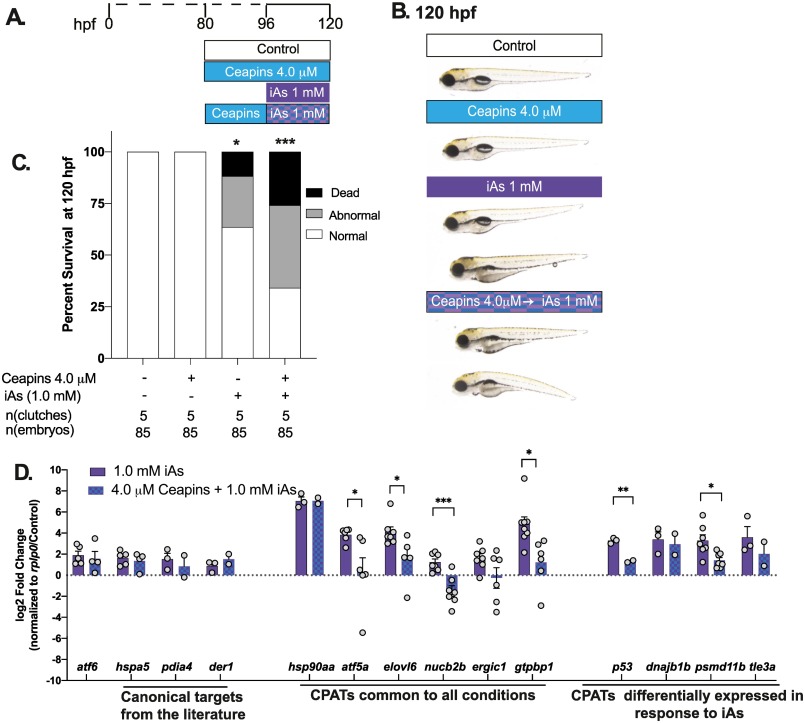
Fig. 6. Atf6 inhibition by Ceapins A7 suppresses CPAT expression during acute iAs exposure
(A) Exposure scheme showing zebrafish larvae were pre-treated with 4.0 uM Ceapins from 80 hpf and then co-exposed to 1 mM iAs and Ceapins from 96 to 120 hpf. (B) Representative images of 120 hpf zebrafish larvae subjected to treatments in (A). Arrow highlights the phenotypes such as spinal curvature, edema, distended gut and brain necrosis (darkening of the head) compared to controls. (C) Percent of normal, abnormal and dead zebrafish at 120 hpf per treatment condition; n = 85, 5 clutches; *** p < 0.0005, *p < 0.05, by two-way ANOVA. (D) Gene expression analysis by qPCR depicting log2 of the fold change (L2FC) of select genes categorized as canonical Atf6 targets in other studies, CPATs that were commonly DE in all three conditions and CPATs that were uniquely DE in iAs. (**** p < 0.00005, **p < 0.005, *p < 0.05, by unpaired t-test)