
- Title
-
Object detection for automatic cancer cell counting in zebrafish xenografts
- Authors
- Albuquerque, C., Vanneschi, L., Henriques, R., Castelli, M., Póvoa, V., Fior, R., Papanikolaou, N.
- Source
- Full text @ PLoS One
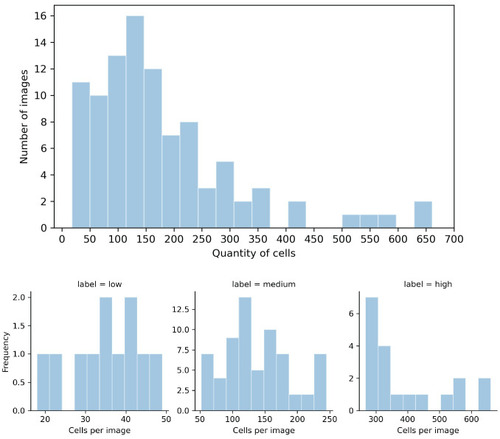
Distributions of the number of cells in the considered images.
The top histogram shows the distribution for the whole data set, and the bottom histograms show the distributions for the low, medium, and high levels of complexity. In a range of 18 to 661 cells, the majority of images had at most 250 cells. Only eleven images had fewer than 50 cells, and nineteen images had more than 250. |
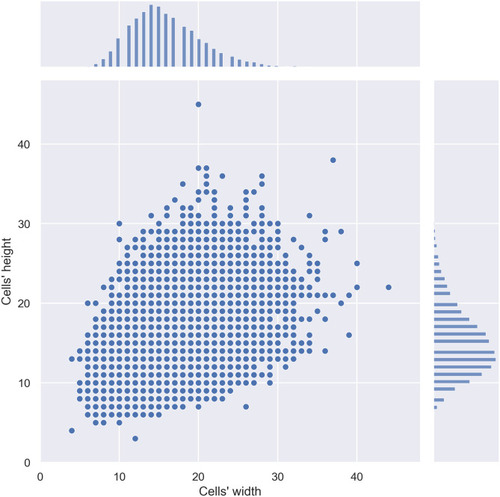
Joint and marginal distribution plot representing the density and distribution of the cells according to their width and height.
Although it is normally distributed, we can verify the significant variance of cell morphology available in the data set. |
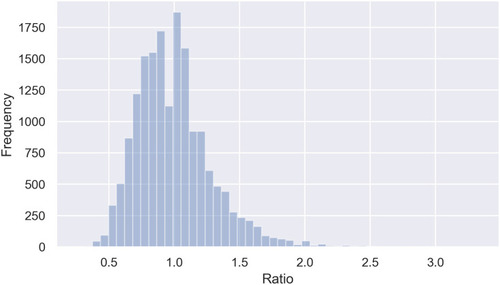
Histogram plot for the frequency of cells according to their ratio (width/height).
The cells’ ratio, which can influence the aspect ratio definition in Faster R-CNN, varied between 0.3 and 3.3. |
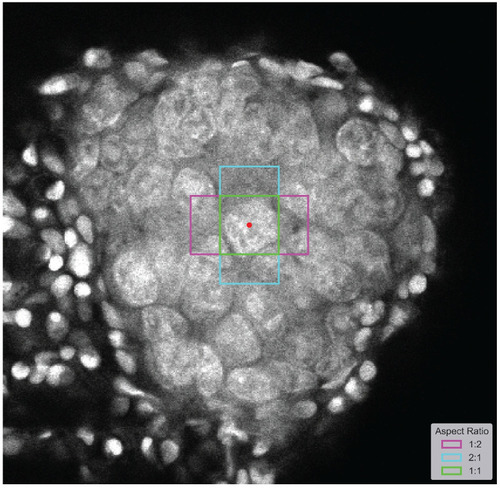
Example of possible aspect ratios, taking into account the ratio distribution.
The magenta shape corresponds to a 1:2 aspect ratio, the blue corresponds to a 2:1 aspect ratio, and the green corresponds to a square. The red dot is the anchor. |
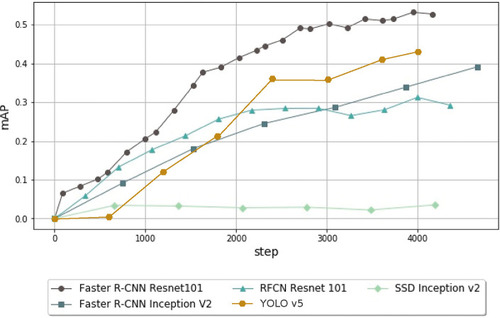
Performance comparison using the mAP of the object-detection models trained using various meta-architectures (Faster R-CNN, SSD, YOLO and RFCN) for 4,000 steps.
Faster algorithms such as SSD cannot deal with the complexity of the problem. Faster R-CNN emphasizes accuracy over speed and can achieve over six times better performance than SSD with the same feature extractor. YOLO v5, the last version of YOLO, outperforms SSD and RFCN, but Faster R-CNN still has an advantage of 0.1 mAP at 4,000 steps. |
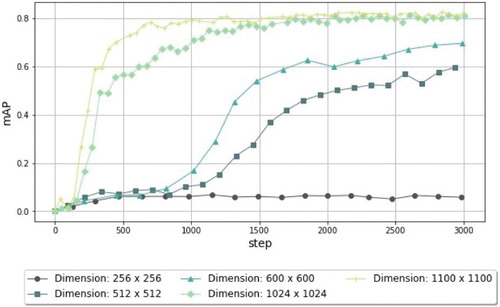
Performance comparison using the mAP of the object-detection models trained using different image sizes (from 256 × 256 pixels to 1100 × 1100 pixels) for 3,000 steps.
When dealing with very small cells with a small number of pixels, it is important to increase the resolution of the image to improve the richness of features. In this way, the detector can correctly identify and classify the cells. |
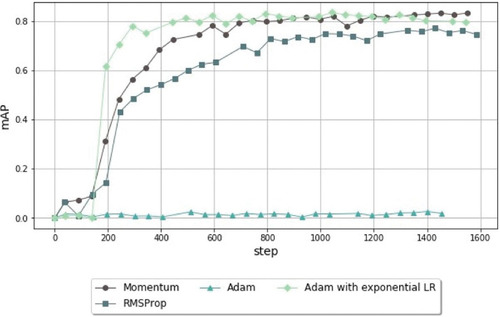
Comparison of mAP performance of the object-detection models trained using different optimizers (Momentum, Adam, Adam with exponential learning rate, and RMSProp) for 1,400 steps.
Adam, which is known for achieving a faster convergence than the remaining optimizers, cannot achieve a satisfying performance if the learning rate decay is not well adjusted. |
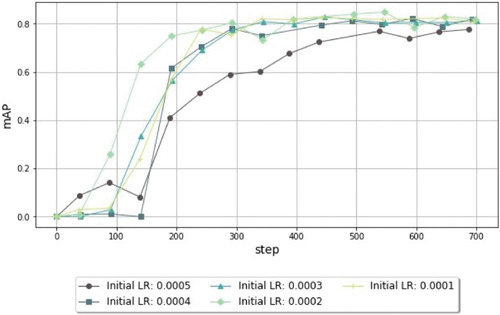
Comparison of mAP values from the object-detection models trained using different initial learning rates (LR) for 700 steps.
After a set of experiments where we test the learning rate with different orders of magnitude, the range of values between 0.0001 and 0.0005 leads to an improvement in the mAP. In this range, the value of 0.0002 results in faster convergence. |