
Image
|
Figure Caption
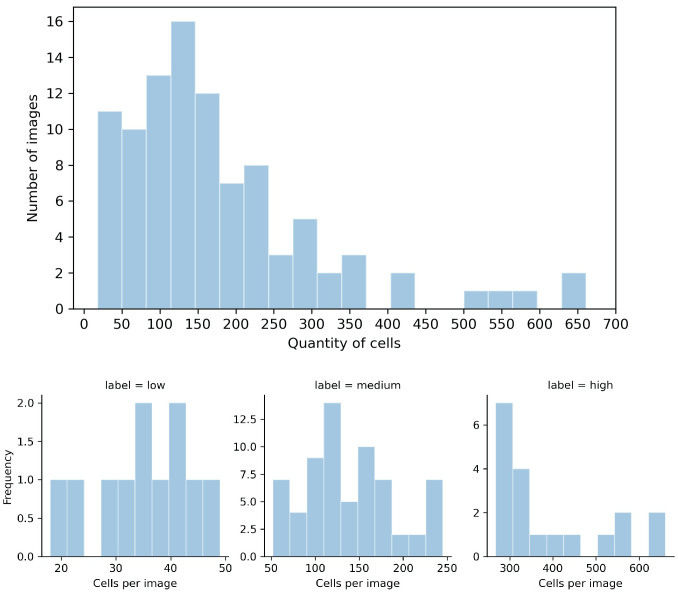
Fig 1
Distributions of the number of cells in the considered images.
The top histogram shows the distribution for the whole data set, and the bottom histograms show the distributions for the low, medium, and high levels of complexity. In a range of 18 to 661 cells, the majority of images had at most 250 cells. Only eleven images had fewer than 50 cells, and nineteen images had more than 250.
Acknowledgments
This image is the copyrighted work of the attributed author or publisher, and
ZFIN has permission only to display this image to its users.
Additional permissions should be obtained from the applicable author or publisher of the image.
Full text @ PLoS One