
Image
|
Figure Caption
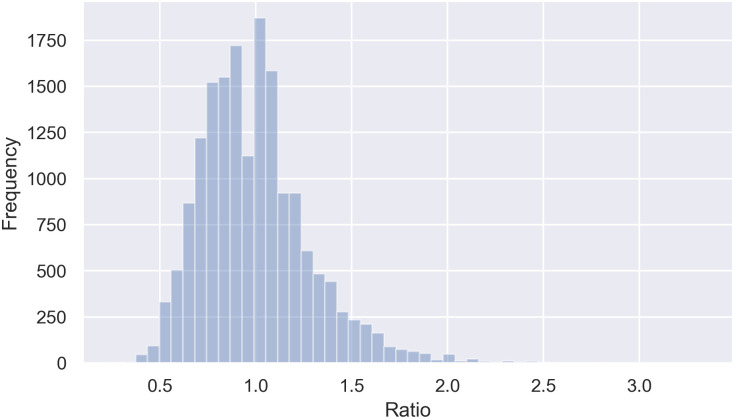
Fig 3
Histogram plot for the frequency of cells according to their ratio (width/height).
The cells’ ratio, which can influence the aspect ratio definition in Faster R-CNN, varied between 0.3 and 3.3.
Acknowledgments
This image is the copyrighted work of the attributed author or publisher, and
ZFIN has permission only to display this image to its users.
Additional permissions should be obtained from the applicable author or publisher of the image.
Full text @ PLoS One