
Image
|
Figure Caption
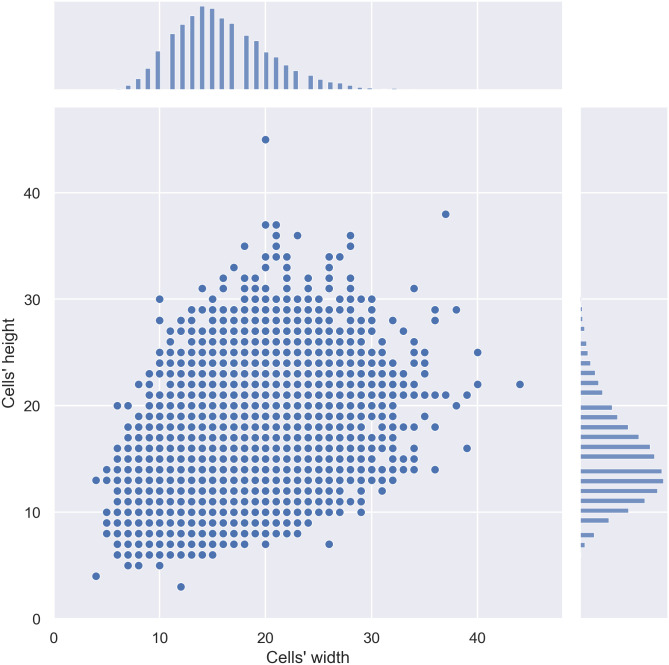
Fig 2
Joint and marginal distribution plot representing the density and distribution of the cells according to their width and height.
Although it is normally distributed, we can verify the significant variance of cell morphology available in the data set.
Acknowledgments
This image is the copyrighted work of the attributed author or publisher, and
ZFIN has permission only to display this image to its users.
Additional permissions should be obtained from the applicable author or publisher of the image.
Full text @ PLoS One