
- Title
-
Precise visuomotor transformations underlying collective behavior in larval zebrafish
- Authors
- Harpaz, R., Nguyen, M.N., Bahl, A., Engert, F.
- Source
- Full text @ Nat. Commun.
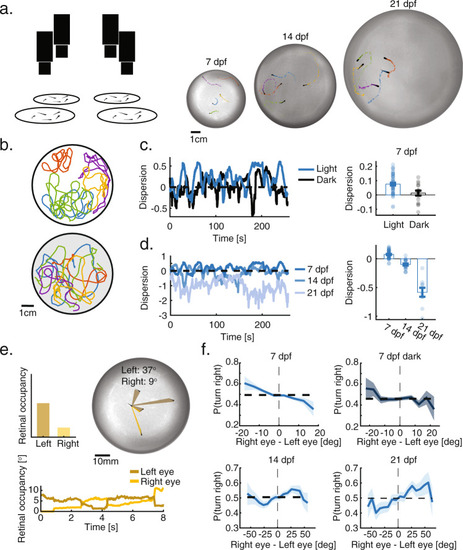
Group structure depends on visual interactions and develops with age.
a Left: Experimental system. Multiple cameras capture the behavior of multiple groups and individuals swimming freely in separate arenas. Right: Example images and trajectories of groups of 5 larvae at 7, 14, and 21 dpf. Different colors represent different fish in the groups. b Example trajectories (recorded over 5 min) of groups of 5 larvae at age 7 dpf, swimming together in the light (top) or in total darkness (bottom). Different colors represent different fish. c Left: Normalized dispersion values for one group swimming together in the light (blue) and in the dark (black). Zero represents the average dispersion value expected when fish do not interact, and positive values represent overdispersed distributions (“Methods”). Right: groups of 7 dpf fish are more dispersed than is expected by chance (p = |

Virtual reality reveals the algorithms fish use to integrate visual social information.
a Left: Testing fish social interactions using closed-loop projection of simplified moving objects mimicking neighbors (“Methods”). Right: A pinhole model of the retina is used to estimate the shape, size and position of the image of the projected object on the retina of the fish (black shapes). Both retinae are modeled as spheres, red dots are the center of the back of the retina and red lines represent the horizon line (“Methods”). b Examples of the cumulative turning angles for one fish responding to a single dot (36o) mimicking a neighbor moving in bouts in the left visual field (red lines) and in the right one (gray lines) over 40 trials. Bold lines represent averages over trials; vertical lines represent times when stimulus is turned on and off during the trials. c Left: Probability to turn right per bout when a single moving dot of different sizes is presented to the left of the fish (N = 24 fish, ““Methods””). Right: Probability to turn away from moving dots of different sizes presented to the left of the fish, calculated over the entire stimulus duration. At 7 dpf, larvae consistently turn away from the side of the projected image. d Left: Probability to turn right per bout in response to ellipses of increasing vertical size (perpendicular to the plane of the eye), while the horizontal size remains constant at 9o (N = 32 fish). Inset shows the image of the vertical ellipse on the retina. Right: Probability to turn right per bout in response to ellipses of increasing horizontal sizes (parallel to the plane of the eye), while the vertical size remains constant at 9o (N = 32 fish). Inset shows the image of the horizontal ellipse on the retina. e Probability to turn right per bout in response to two images presented together to the left visual field (green line); to each of the images presented alone (blue lines) and the prediction based on the weighted average of the responses to each stimulus presented alone (red line, “Methods”), where weights represent the relative sizes of the stimuli (N = 32 fish). f Probability to turn right per bout in response to two dots presented simultaneously to each eye of the fish (green line); to each dot presented alone (blue lines) and the prediction based on the linear summation of the (competing) recorded response biases to each dot presented alone (red line, “Methods”)(N = 24 fish). In panels (c–f), probability to turn right per bout is calculated as the fraction of right turns out of all turns in 1.25 s time bins. Bold lines are average; shaded areas are SEM. |
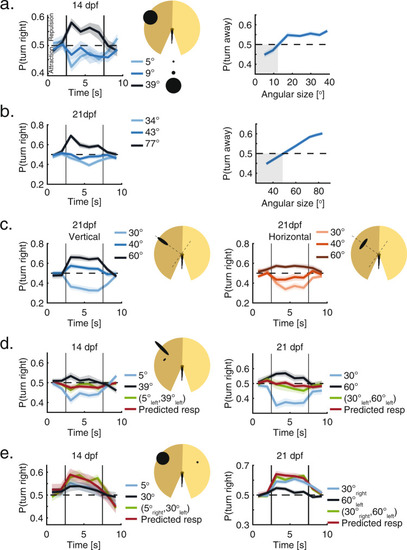
Older larvae use similar algorithms to integrate visual social information.
a Left: Probability to turn right per bout in response to dots of different sizes presented to the left visual field. At 14 dpf, fish show both attraction to small angular sizes and repulsion from larger sizes (N = 32 fish). Right: Probability to turn away from dots of different sizes, presented to the left of the fish, calculated over the entire stimulus duration. Gray shaded area marks retinal occupancy values for which fish exhibit attraction. b Same as in A, only for 21 dpf larvae (“Methods”). c Left: Probability of 21 dpf larvae to turn right per bout, in response to ellipses of increasing vertical size (perpendicular to the plane of the eye), while horizontal sizes remain constant at 23o (N = 32 fish). Right: Same but in response to ellipses of increasing horizontal sizes (parallel to the plane of the eye), while vertical sizes remain constant at 23o (N = 32 fish). d Left: Probability to turn right per bout in response to two images presented together to the left visual field of 14 dpf larvae (green line); to each of the images presented alone (blue lines) and the prediction based on the weighted average of the responses to each stimulus presented alone (red line, “Methods”), where the weights of the responses are equal (N = 32 fish). Right: Same but for 21 dpf larvae. e Left: Probability to turn right per bout in response to two dots presented simultaneously to both eyes of 14 dpf larvae (green line); for each dot presented alone (blue lines) and the prediction based on the linear summation of the recorded response biases to each dot presented alone (red line, “Methods”)(N = 32 fish). Right: same but for 21 dpf larvae. In all panels probability to turn right per bout is calculated as the fraction of right turns out of all turns in 1.25 s time bins (“Methods”). Bold lines are average; shaded areas are SEM. |
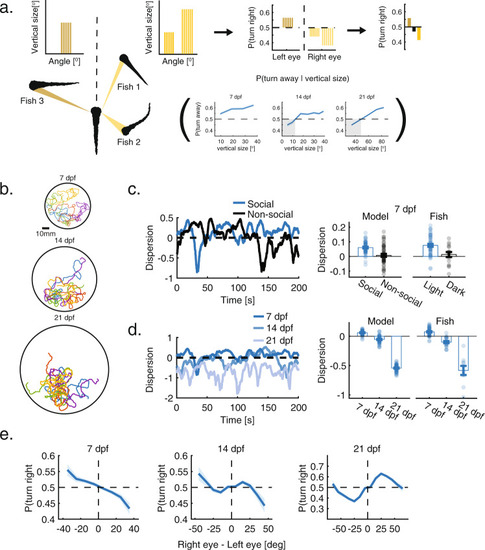
Social interactions extracted from VR capture the behavior of real groups.
a Models are based on the vertical visual occupancy casted by neighbors on the retina of the focal fish and the algorithms and response functions extracted from VR experiments (Eq. 1 and “Methods”). Left: Each neighbor is represented by its estimated vertical size at specific visual angels. Middle: The vertical sizes casted by neighbors elicit a turning bias based on the age dependent response functions observed in VR experiments |
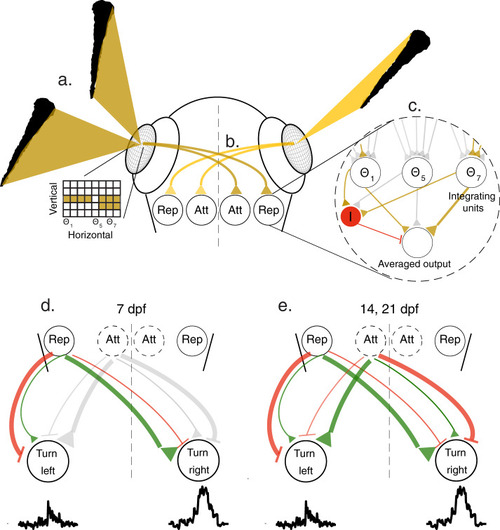
Conceptual circuit model describing visuomotor transformation underlying social interactions.
a Images casted by neighboring fish on the retina of the focal fish are represented as a two-dimensional grid of retinal ganglion cells mapping the vertical height of the neighbors at different viewing angles |