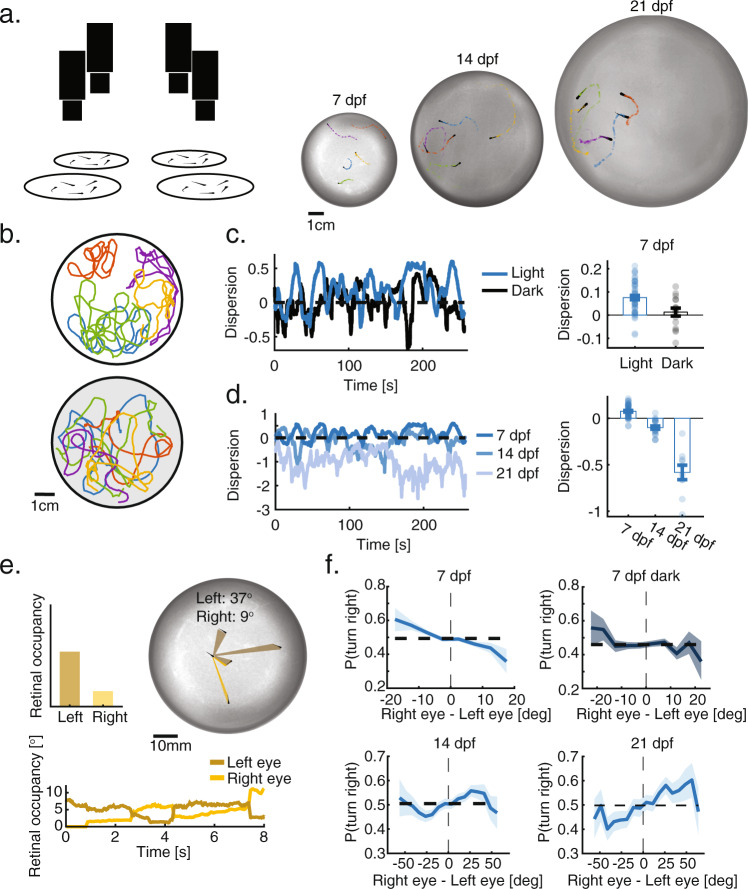
Figure Caption
Group structure depends on visual interactions and develops with age.a Left: Experimental system. Multiple cameras capture the behavior of multiple groups and individuals swimming freely in separate arenas. Right: Example images and trajectories of groups of 5 larvae at 7, 14, and 21 dpf. Different colors represent different fish in the groups. b Example trajectories (recorded over 5 min) of groups of 5 larvae at age 7 dpf, swimming together in the light (top) or in total darkness (bottom). Different colors represent different fish. c Left: Normalized dispersion values for one group swimming together in the light (blue) and in the dark (black). Zero represents the average dispersion value expected when fish do not interact, and positive values represent overdispersed distributions (“Methods”). Right: groups of 7 dpf fish are more dispersed than is expected by chance (p = 8×10⁻¹⁰, Nlight = 48 groups, two-sided t test; t = 7.7) and are also more dispersed than groups swimming in total darkness (p = 0.0016, Ndark = 16 groups; two sided t test, 𝑡=3.3; Cohen’s d = 0.95). Bars represent mean over groups; error bars are SEM. d Left: Example dispersion values for groups at 7, 14, and 21 dpf. Right: At 14 and 21 dpf group are significantly less dispersed (more aggregated) than chance (p14 = 3×10⁻⁵, p21 = 6×10⁻⁵; N14 = 21, N21 = 10; two sided t test; 𝑡14=−5.3,𝑡21=−7), and dispersion also decreases significantly over development (p = 6×10⁻²⁶, one-way ANOVA; 𝐹=137). Bars represent mean over groups; error bars are SEM. e Top: Image showing the total retinal occupancy that neighbors cast on each of the eyes of a focal fish. Bottom: Example traces of the total retinal occupancy for each of the eyes over 8 s. f Probability to turn right (per bout) as a function of the difference in retinal occupancy experienced by each eye (negative values - higher occupancy to the left). At 7 dpf, larvae tend to turn away from the more occupied side and do not respond to neighbors in total darkness (Top row). At 14 dpf, fish begin turning towards the more occupied side, and this tendency increases at 21 dpf (Bottom row). Bold lines represent turning probability calculated as the fraction of right turns out of all turns collected from all fish in 5o bins; error bars are the 95% confidence interval of the fitted Binomial distribution to the events in each bin.