
|
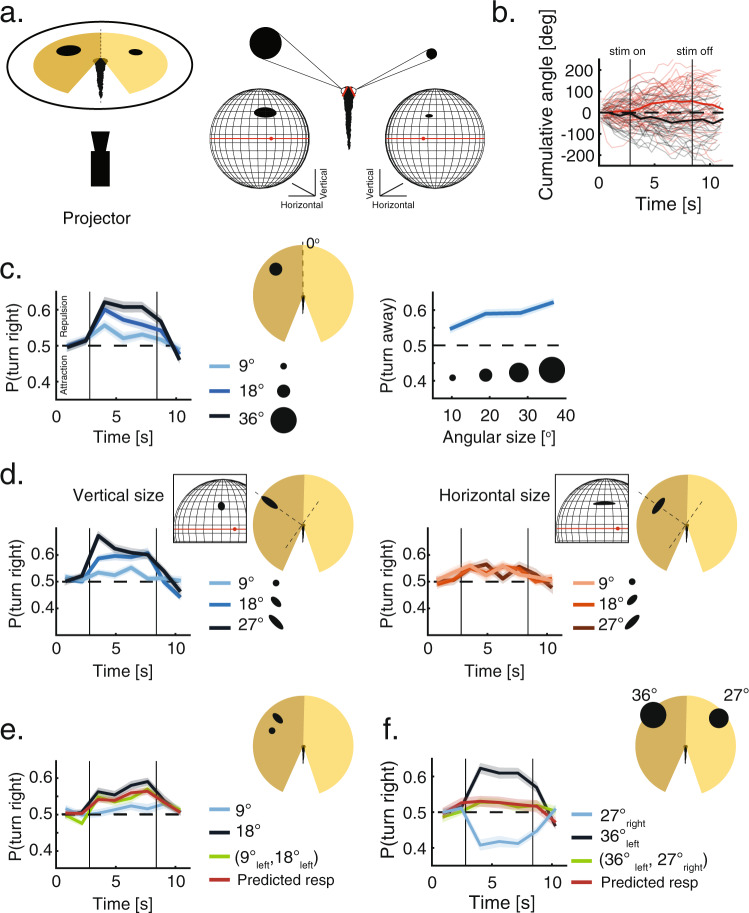
Fig. 2
a Left: Testing fish social interactions using closed-loop projection of simplified moving objects mimicking neighbors (“Methods”). Right: A pinhole model of the retina is used to estimate the shape, size and position of the image of the projected object on the retina of the fish (black shapes). Both retinae are modeled as spheres, red dots are the center of the back of the retina and red lines represent the horizon line (“Methods”). b Examples of the cumulative turning angles for one fish responding to a single dot (36o) mimicking a neighbor moving in bouts in the left visual field (red lines) and in the right one (gray lines) over 40 trials. Bold lines represent averages over trials; vertical lines represent times when stimulus is turned on and off during the trials. c Left: Probability to turn right per bout when a single moving dot of different sizes is presented to the left of the fish (N = 24 fish, ““Methods””). Right: Probability to turn away from moving dots of different sizes presented to the left of the fish, calculated over the entire stimulus duration. At 7 dpf, larvae consistently turn away from the side of the projected image. d Left: Probability to turn right per bout in response to ellipses of increasing vertical size (perpendicular to the plane of the eye), while the horizontal size remains constant at 9o (N = 32 fish). Inset shows the image of the vertical ellipse on the retina. Right: Probability to turn right per bout in response to ellipses of increasing horizontal sizes (parallel to the plane of the eye), while the vertical size remains constant at 9o (N = 32 fish). Inset shows the image of the horizontal ellipse on the retina. e Probability to turn right per bout in response to two images presented together to the left visual field (green line); to each of the images presented alone (blue lines) and the prediction based on the weighted average of the responses to each stimulus presented alone (red line, “Methods”), where weights represent the relative sizes of the stimuli (N = 32 fish). f Probability to turn right per bout in response to two dots presented simultaneously to each eye of the fish (green line); to each dot presented alone (blue lines) and the prediction based on the linear summation of the (competing) recorded response biases to each dot presented alone (red line, “Methods”)(N = 24 fish). In panels (c–f), probability to turn right per bout is calculated as the fraction of right turns out of all turns in 1.25 s time bins. Bold lines are average; shaded areas are SEM.