Figure Caption
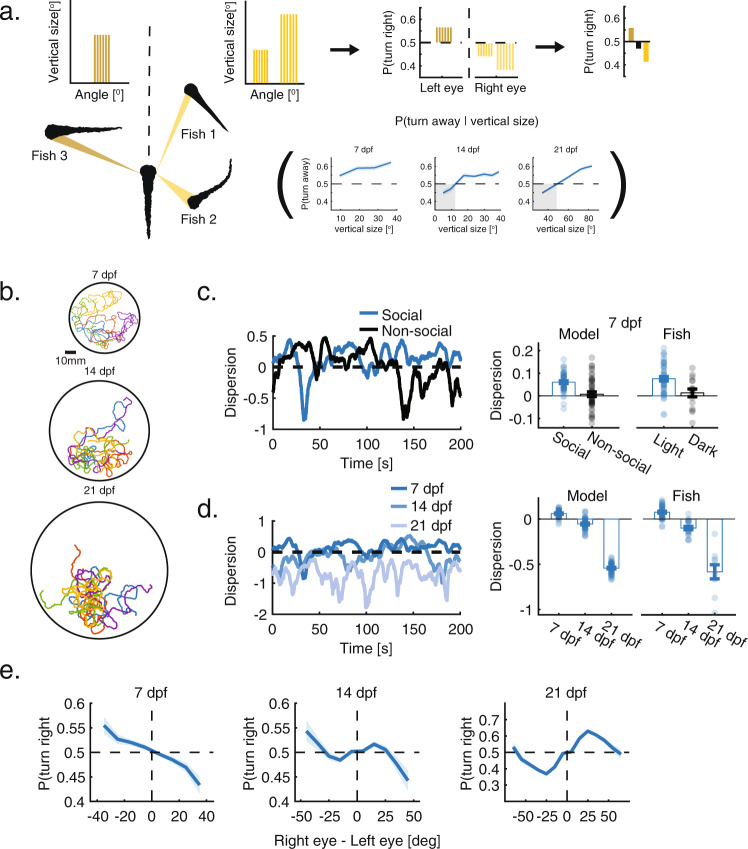
Social interactions extracted from VR capture the behavior of real groups.a Models are based on the vertical visual occupancy casted by neighbors on the retina of the focal fish and the algorithms and response functions extracted from VR experiments (Eq. 1 and “Methods”). Left: Each neighbor is represented by its estimated vertical size at specific visual angels. Middle: The vertical sizes casted by neighbors elicit a turning bias based on the age dependent response functions observed in VR experiments 𝑝(𝑡𝑢𝑟𝑛𝑟𝑖𝑔ℎ𝑡∣𝑣𝑖). Right: The turning biases are then averaged on each side (yellow bars) and compared between the eyes to elicit a turing probability 𝑝(𝑡𝑢𝑟𝑛𝑟𝑖𝑔ℎ𝑡) (black bar) for the next bout performed by the fish (“Methods”). b Examples of simulated trajectories for 7, 14, and 21 dpf larvae in arena sizes that match real group experiments. c Left: Normalized dispersion values for one simulated group of 5 fish at 7 dpf, with and without social interactions. Zero represents the expected average dispersion when fish do not interact, and positive values represent overdispersed distributions (“Methods”). Right: Simulated groups of 5 fish at 7 dpf modeled with social interactions show higher dispersion levels than chance and are also more dispersed than simulated groups modeled without social interactions. Bars represent means; error bars are SEM (N = 50 simulations). Experimental data of fish swimming in the light and in the dark is plotted for comparison (same as Fig. c). d Same as in (c), only for simulations of different age groups. Simulated groups switch from overdispersed to clustered groups from 7 to 21 dpf. Experimental data of different age groups is plotted for comparison (same as Fig. 1d). e Probability to turn right as a function of the difference in total angular occupancy experienced by each eye (negative values - higher occupancy to the left) in the simulations. (Similar to Fig. for group experiments). Bold lines represent turning probability calculated as the fraction of right turns out of all turns collected from all simulated fish in 5o bins; error bars are the 95% confidence interval of the fitted Binomial distribution to the events in each bin.