FIGURE SUMMARY
Title

Contributions of Luminance and Motion to Visual Escape and Habituation in Larval Zebrafish

Authors
Mancienne, T., Marquez-Legorreta, E., Wilde, M., Piber, M., Favre-Bulle, I., Vanwalleghem, G., Scott, E.K.
Source
Full text @ Front. Neural Circuits

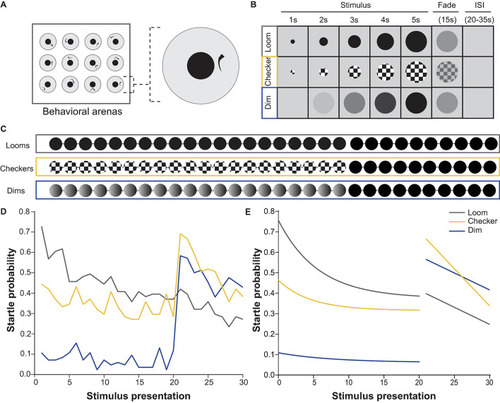
Behavioral responses to repeated loom, checkerboard, and dim stimuli. (A) Experimental set up used for behavioral experiments, where 12 larvae were presented with stimulus trains from a screen below while their movements were recorded with a camera above. (B) Properties and timing of the loom, checkerboard, and dim stimuli. (C) The three stimulus trains used for behavioral experiments, comprising 20 presentations of one stimulus (either loom, checkerboard, or dim) followed by 10 looms, all separated by interstimulus intervals ranging between 20–35 s. (D) The average probability of an escape response during these experiments, across all larvae. Habituation was significant (p = 4.28E-7) for loom responses, but not for checkerboard (p = 0.01325535) or dim (p = 0.8195796, tested with the nparLD R package, using Bonferroni correction for multiple comparisons, adjusting the p-value for significance to 0.00625). Responses to the first loom (21st stimulus) were not significantly different from naive loom responses for animals shown checkerboards (p = 0.4875) or dims (p = 0.05995, tested with a Mann–Whitney U test, using Bonferroni correction for multiple comparisons, adjusting the p-value for significance to 0.00625). (E) Fitted curves to the average probability of escape response shown in panel (D) illustrate the habituation profile to each stimulus type.

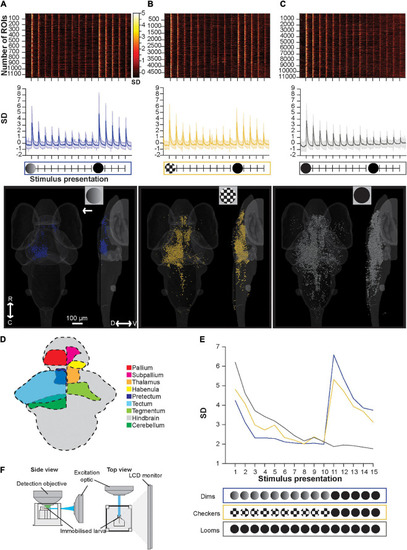
Brain-wide calcium responses to repeated loom, checkerboard, and dim stimuli. (A) A raster plot (top), average trace with S.D. shaded (middle), and transverse and lateral spatial distributions (bottom) of dim sensitive ROIs, arrow represents position of stimulus presentation. (B) Shows the same information for ROIs sensitive to checkerboards, and panel (C) shows this information for ROIs responsive to looms. (D) Schematic representation of key regions’ locations in the larval zebrafish brain. (E) The average maximum brain-wide response of dim, checkerboard, and loom sensitive ROIs and the stimulus trains used during these calcium imaging experiments. Habituation was significant (p = 3.42E-18) for loom sensitive ROIs, checkerboard sensitive ROIs (p = 1.91E-8) and dim sensitive ROIs (p = 2.43E-4, tested with the nparLD R package, using Bonferroni correction for multiple comparisons, adjusting the p-value for significance to 0.01). Responses to the first loom (11th stimulus) were not significantly different from naive loom responses for animals shown checkerboards (p = 0.1513) or dims (p = 0.4491, tested with a Mann–Whitney U test, using Bonferroni correction for multiple comparisons, adjusting the p-value for significance to 0.01). (F) Experimental set up used for calcium imaging experiments, where larval zebrafish are presented the stimulus train on an LED monitor. R, rostral; C, caudal; D, dorsal; V, ventral.

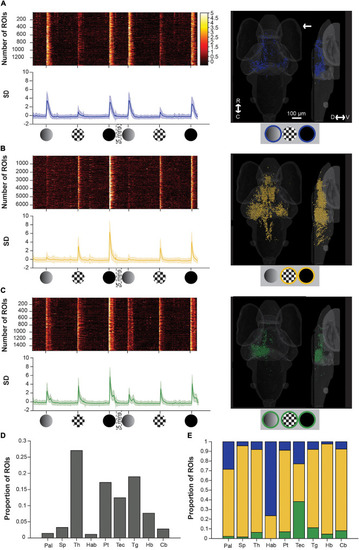
Brain-wide calcium responses to dim, checkerboard, and loom stimuli. (A) A raster plot (top left), average trace with S.D. shaded (bottom left) and transverse and lateral spatial distributions (right) of ROIs responsive to dim and loom stimuli. Response strengths are shown in S.D., and the arrow shows the position of the stimulus presentation. (B) Shows the same information for ROIs responsive to checkerboards and looms, and panel (C) shows this information for ROIs responsive to all three stimuli. (D) Average proportion of ROIs within each brain region that are visually responsive. (E) Average proportion of visually responsive ROIs within each brain region that are either dim sensitive (blue), checkerboard sensitive (yellow), or sensitive to both dim and checkerboard (green). R, rostral; C, caudal; D, dorsal; V, ventral; Pal, pallium; Sp, subpallium; Th, thalamus; Hab, habenula; Pt, pretectum; Tec, tectum; Tg, tegmentum; Hb, hindbrain; Cb, cerebellum.

Component sensitive responses and their associated rates of habituation. (A) A raster plot (top left), average trace with S.D. shaded (bottom left), transverse and lateral spatial distributions (middle), and histogram of their rate of decay as modeled from fitting with an exponential decay curve (right) for ROIs responsive to dim and full loom stimuli. ROIs with responses ≥5.0 are pooled. Response strengths are shown in S.D., and the arrow shows the position of the stimulus presentation. (B) Showing the same information as above but for ROIs responsive to checkerboards and full loom stimuli, (C) same as above but for ROIs responsive to dims, checkerboards and full loom stimuli. R, rostral; C, caudal; D, dorsal; V, ventral.

Acknowledgments
This image is the copyrighted work of the attributed author or publisher, and ZFIN has permission only to display this image to its users. Additional permissions should be obtained from the applicable author or publisher of the image. Full text @ Front. Neural Circuits