FIGURE

FIGURE 3

ID
ZDB-FIG-211111-8
Publication
Mancienne et al., 2021 - Contributions of Luminance and Motion to Visual Escape and Habituation in Larval Zebrafish
Other Figures
All Figure Page
Back to All Figure Page
FIGURE 3

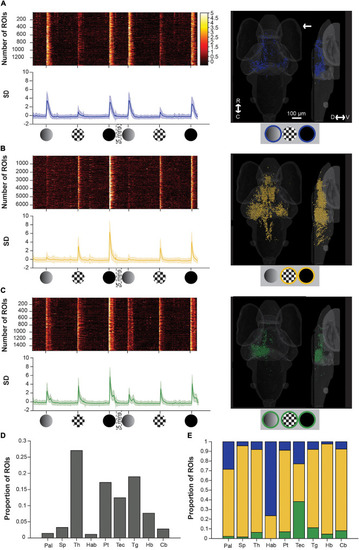
Brain-wide calcium responses to dim, checkerboard, and loom stimuli. (A) A raster plot (top left), average trace with S.D. shaded (bottom left) and transverse and lateral spatial distributions (right) of ROIs responsive to dim and loom stimuli. Response strengths are shown in S.D., and the arrow shows the position of the stimulus presentation. (B) Shows the same information for ROIs responsive to checkerboards and looms, and panel (C) shows this information for ROIs responsive to all three stimuli. (D) Average proportion of ROIs within each brain region that are visually responsive. (E) Average proportion of visually responsive ROIs within each brain region that are either dim sensitive (blue), checkerboard sensitive (yellow), or sensitive to both dim and checkerboard (green). R, rostral; C, caudal; D, dorsal; V, ventral; Pal, pallium; Sp, subpallium; Th, thalamus; Hab, habenula; Pt, pretectum; Tec, tectum; Tg, tegmentum; Hb, hindbrain; Cb, cerebellum.

Expression Data

Expression Detail
Antibody Labeling
Phenotype Data

Phenotype Detail
Acknowledgments
This image is the copyrighted work of the attributed author or publisher, and ZFIN has permission only to display this image to its users. Additional permissions should be obtained from the applicable author or publisher of the image. Full text @ Front. Neural Circuits