IMAGE

FIGURE 4

ID
ZDB-IMAGE-211111-14
Source
Figures for Mancienne et al., 2021
Image
Figure Caption

FIGURE 4

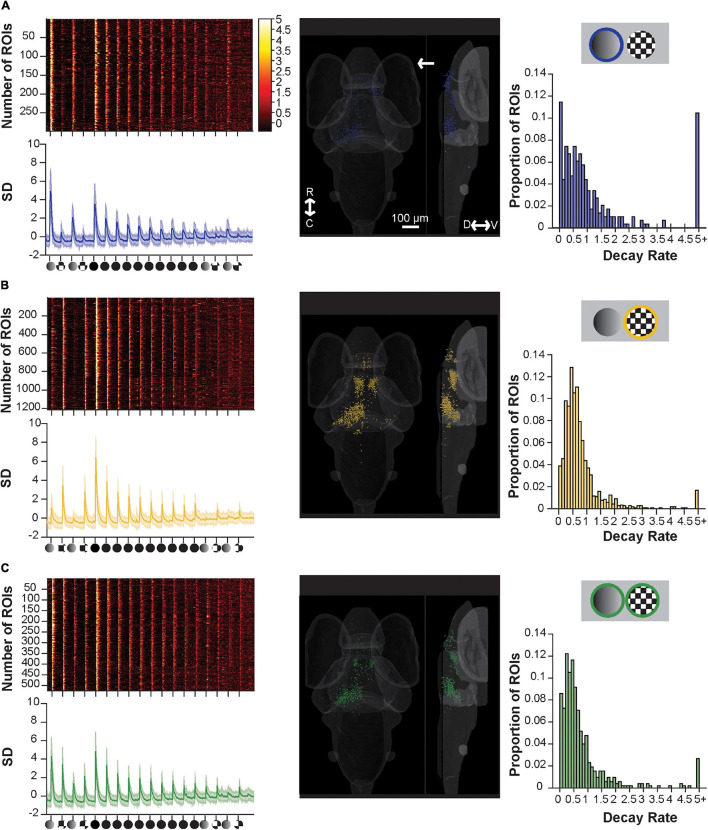
Component sensitive responses and their associated rates of habituation. (A) A raster plot (top left), average trace with S.D. shaded (bottom left), transverse and lateral spatial distributions (middle), and histogram of their rate of decay as modeled from fitting with an exponential decay curve (right) for ROIs responsive to dim and full loom stimuli. ROIs with responses ≥5.0 are pooled. Response strengths are shown in S.D., and the arrow shows the position of the stimulus presentation. (B) Showing the same information as above but for ROIs responsive to checkerboards and full loom stimuli, (C) same as above but for ROIs responsive to dims, checkerboards and full loom stimuli. R, rostral; C, caudal; D, dorsal; V, ventral.

Acknowledgments
This image is the copyrighted work of the attributed author or publisher, and ZFIN has permission only to display this image to its users. Additional permissions should be obtained from the applicable author or publisher of the image. Full text @ Front. Neural Circuits