IMAGE

FIGURE 1

ID
ZDB-IMAGE-211111-11
Source
Figures for Mancienne et al., 2021
Image
Figure Caption

FIGURE 1

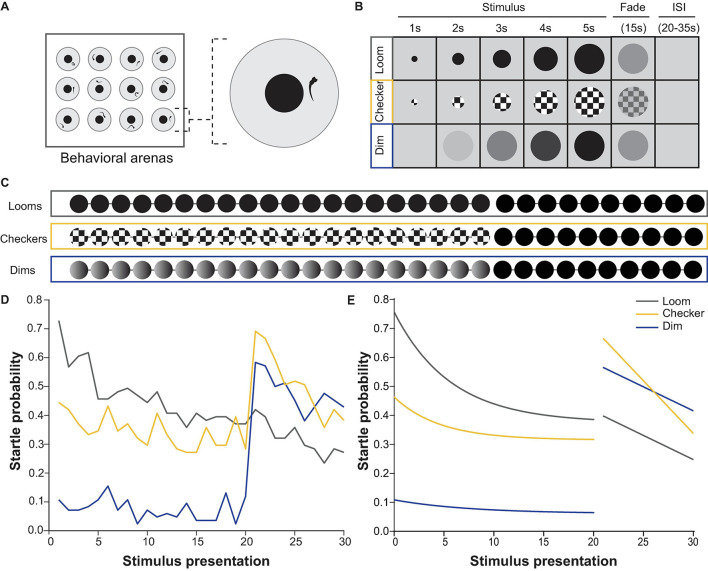
Behavioral responses to repeated loom, checkerboard, and dim stimuli. (A) Experimental set up used for behavioral experiments, where 12 larvae were presented with stimulus trains from a screen below while their movements were recorded with a camera above. (B) Properties and timing of the loom, checkerboard, and dim stimuli. (C) The three stimulus trains used for behavioral experiments, comprising 20 presentations of one stimulus (either loom, checkerboard, or dim) followed by 10 looms, all separated by interstimulus intervals ranging between 20–35 s. (D) The average probability of an escape response during these experiments, across all larvae. Habituation was significant (p = 4.28E-7) for loom responses, but not for checkerboard (p = 0.01325535) or dim (p = 0.8195796, tested with the nparLD R package, using Bonferroni correction for multiple comparisons, adjusting the p-value for significance to 0.00625). Responses to the first loom (21st stimulus) were not significantly different from naive loom responses for animals shown checkerboards (p = 0.4875) or dims (p = 0.05995, tested with a Mann–Whitney U test, using Bonferroni correction for multiple comparisons, adjusting the p-value for significance to 0.00625). (E) Fitted curves to the average probability of escape response shown in panel (D) illustrate the habituation profile to each stimulus type.

Acknowledgments
This image is the copyrighted work of the attributed author or publisher, and ZFIN has permission only to display this image to its users. Additional permissions should be obtained from the applicable author or publisher of the image. Full text @ Front. Neural Circuits