
- Title
-
Mosmo Is Required for Zebrafish Craniofacial Formation
- Authors
- Camacho-Macorra, C., Sintes, M., Tabanera, N., Grasa, I., Bovolenta, P., Cardozo, M.J.
- Source
- Full text @ Front Cell Dev Biol
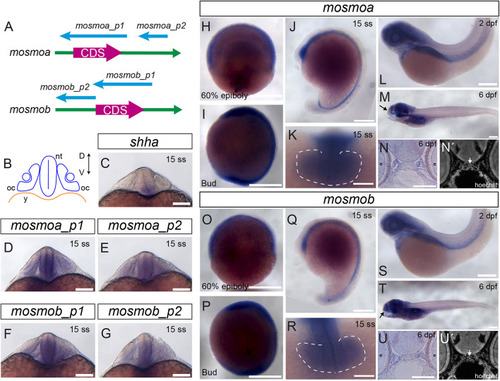
Figure 1. Mosmo paralogs show a largely overlapping distribution in zebrafish. (A) Schematic representation of mosmoa and mosmob mRNAs and probes used for in situ hybridization (ISH). p1, probe #1. p2, probe #2. (B) Schematic representation of a frontal section of a zebrafish embryo at 20 hpf at the level of the optic cup. Expression pattern of shha (C), mosmoa (D,E) and mosmob (F,G) at 20 hpf. Note that the two probes for mosmoa and mosmob show an identical distribution. Note also that both paralogs have an overlapping distribution in the ventral neural tube but more dorsally extended than that of shha. (H,U) Expression pattern of embryos hybridized with mosmoa and mosmob at 60% epiboly (H,O), bud (I,P) and 15 ss stage (J,K,Q,R), 2 dpf (L,S) as well as at 6 dpf (M,T). Note that at 60% epiboly and bud stage the expression of both genes is localized along the ventral anterior-posterior axis of the embryos. At 15 ss, a low level expression of both mosmoa and mosmob is detected in the optic vesicles (K,R, dashed line) and along the ventral neural tube from the diencephalon to the tail bud (J,Q). At 2 and 6 dpf, the expression of both genes localizes to the head region. The eyes were removed in panels (M,T). Frontal sections of 6 dpf embryos hybridized in toto for mosmoa (N) or mosmob (U) and counterstained with Hoechst (N′,U′). ISH signal for both paralogs localizes around the ethmoid cartilage (N,N′,U,U′ white arrows). D, dorsal; V, ventral; oc, optic cup; nt, neural tube; and y, yolk. Scale bars: 200 μM. |
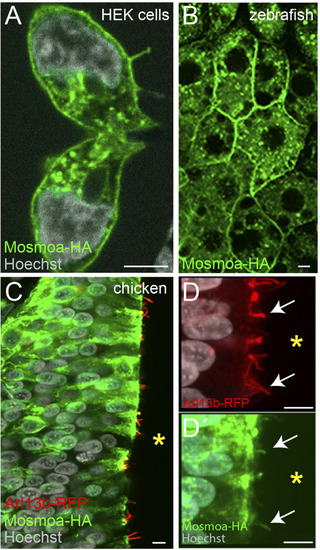
Figure 2. Mosmoa localizes at the plasma membrane, endosomes, and primary cilia. (A) Example of human embryonic kidney (HEK) cells transfected with mosmoa-HA, immunostained for α-HA (green), and counterstained with Hoechst (white). (B) Dorsal view of a zebrafish gastrula (7 hpf) injected with mosmoa-HA mRNA and immunostained for α-HA (green). (C–D′) Transversal sections of chick embryo neural tubes co-electroporated with mosmoa-HA and the cilia marker arl13b-RFP. In both HEK cells and zebrafish EVL cells Mosmoa-HA signal localizes at the plasma membrane and in endo-vesicles. In HH14 chick embryos, neural tube Mosmoa-HA is also observed in the in the Arl13b-positive cilia (white arrows) (D,D′). Yellow asterisk marks the neural tube ventricle (C–D′). Scale bars: 5 μm. |
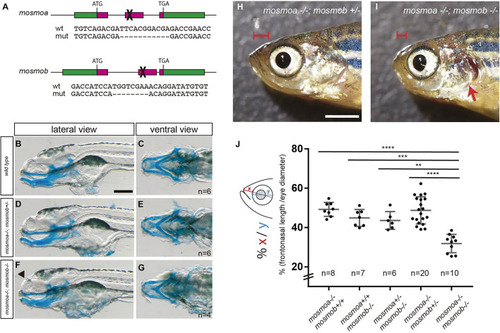
Figure 3. mosmoa–/–;mosmob–/– double mutants display facial abnormalities. (A) Schematic representation of the strategy used to inactivate mosmoa and mosmob zebrafish genes using CRISPR-Cas9 technology and sequence of the selected mutants. (B–G) Lateral and ventral views of 5 dpf wild type (B,C), mosmoa–/–;mosmob± (D,E) and mosmoa–/–;mosmob–/– (F,G) zebrafish larvae stained with Alcian Blue to detect cartilage head organization. The rostral tip of the head appeared flatter in some of the double mutants (F, arrowhead). Eyes were removed for better staining visualization. The number of animals analyzed for each genotype is indicated in the right bottom corner in panels (C,E,G). Scale bar 150 μm. (H,I) Lateral view of adult mosmoa–/–;mosmob± (H) and mosmoa–/–;mosmob–/– double mutants (I). Note that in double mutants the head is flatter and shorter (I, red brackets) than in mosmoa–/–;mosmob± fish and the operculum is abnormal exposing the gills (I, red arrow). (J) Quantification of the distance from the eye to the tip of the preorbital region (x) in relation to the eye size (y) in adult fish of different genotypes. mosmoa–/–;mosmob–/– double mutants show a shorter fronto-nasal length than their siblings. One-way ANOVA followed by Tukey’s multiple comparison tests to analyze differences among groups. **P < 0.01, ***P < 0.001, and ****P < 0.0001. Scale bar 20 mm. |
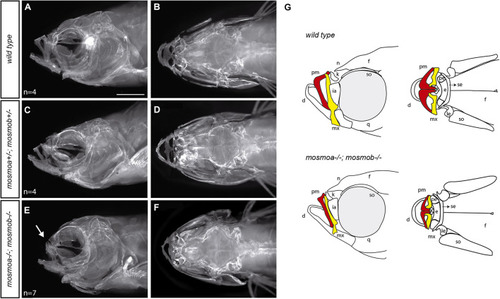
Figure 4. Mosmo paralogs are required for head bone formation in zebrafish. (A–F) Lateral (A,C,E) and dorsal (B,D,F) views of the head of wt (A,B), mosmoa±;mosmob± (C,D) and mosmoa–/–;mosmob–/– (E,F) adult zebrafish stained with alizarin red to label bone tissue. Note the bone malformation in the frontonasal region of mosmoa–/–;mosmob–/– double mutants (E, arrow) in comparison to heterozygous and wt fish (A,C). (G) Cartoons of the craniofacial appearance of wt and mosmoa–/–;mosmob–/– adult mutants, from lateral and dorsal views, highlighting the maxillary (yellow) and premaxillary (red) bones. The number of animals analyzed for each genotype is indicated in the left bottom corner in panels (A,C,E). d, dentary; e, ethmoid; f, frontal; ia, infraorbital; k, kinethmoid; le, lateral ethmoid; mx, maxillary; n, nasal; pe, pre-ethmoid; pm, premaxillary; q, quadrate; se, supraethmoid; and so, supraorbital. Scale bar, 2 mm. PHENOTYPE:
|