
|
FIGURE 3
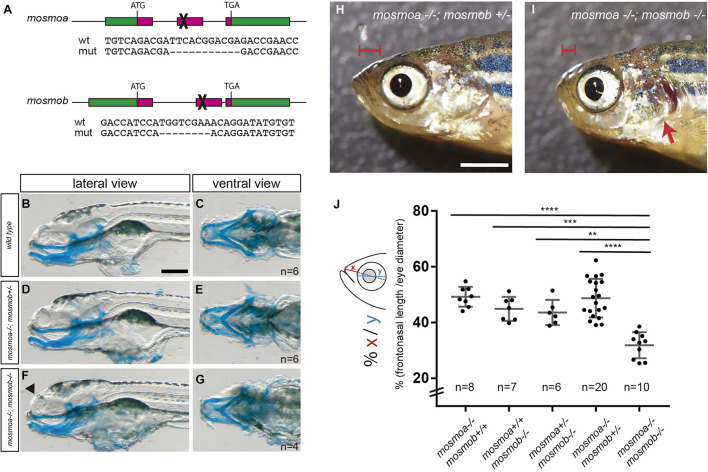
Figure 3. mosmoa–/–;mosmob–/– double mutants display facial abnormalities. (A) Schematic representation of the strategy used to inactivate mosmoa and mosmob zebrafish genes using CRISPR-Cas9 technology and sequence of the selected mutants. (B–G) Lateral and ventral views of 5 dpf wild type (B,C), mosmoa–/–;mosmob± (D,E) and mosmoa–/–;mosmob–/– (F,G) zebrafish larvae stained with Alcian Blue to detect cartilage head organization. The rostral tip of the head appeared flatter in some of the double mutants (F, arrowhead). Eyes were removed for better staining visualization. The number of animals analyzed for each genotype is indicated in the right bottom corner in panels (C,E,G). Scale bar 150 μm. (H,I) Lateral view of adult mosmoa–/–;mosmob± (H) and mosmoa–/–;mosmob–/– double mutants (I). Note that in double mutants the head is flatter and shorter (I, red brackets) than in mosmoa–/–;mosmob± fish and the operculum is abnormal exposing the gills (I, red arrow). (J) Quantification of the distance from the eye to the tip of the preorbital region (x) in relation to the eye size (y) in adult fish of different genotypes. mosmoa–/–;mosmob–/– double mutants show a shorter fronto-nasal length than their siblings. One-way ANOVA followed by Tukey’s multiple comparison tests to analyze differences among groups. **P < 0.01, ***P < 0.001, and ****P < 0.0001. Scale bar 20 mm.