
- Title
-
Analysis of intracellular protein dynamics in living zebrafish embryos using light-sheet fluorescence single-molecule microscopy
- Authors
- Bernardello, M., Gora, R.J., Van Hage, P., Castro-Olvera, G., Gualda, E.J., Schaaf, M.J.M., Loza-Alvarez, P.
- Source
- Full text @ Biomed. Opt. Express
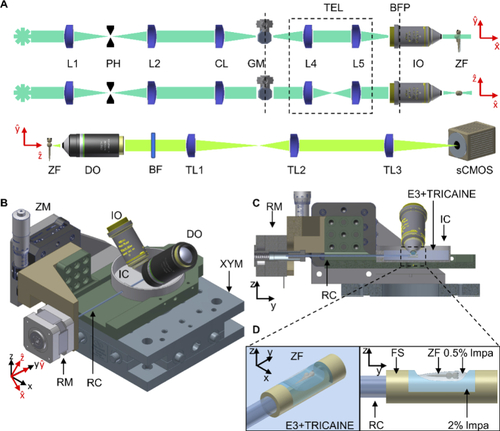
Schematic overview of the LSFM platform for in vivo SMM imaging. (A) schematic of the optical illumination (top two) and detection (bottom one) light paths; (B) schematic of the sample mounting system, with (C) its lateral section view, (D) the FEP support for zebrafish mounting. L = lens, PH = pinhole, CL = cylindrical lens, GM = galvo-mirror, BFP = back focal plane, TEL = telescope plane-conjugating GM to BFP, IO = Illumination objective, DO = detection objective, BF = bandpass filter, TL = tube lens, ZF = zebrafish, RC = rotation capillary, FS = FEP support, RM = rotational motor, IC = imaging chamber, ZM = motorized stage in z, XYM = motorized stage in xy, lmpa = low melting point agarose. |
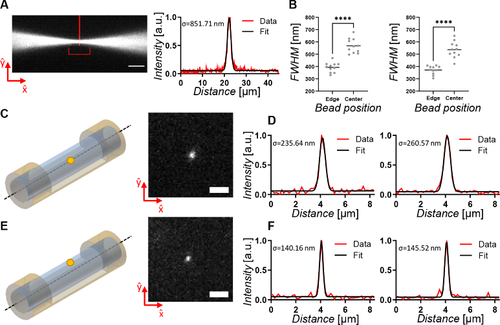
LSFSMM system performances. (A) Illumination light beam focused by removal of the cylindrical lens. Measurement of the intensity profile through a Gaussian fit demonstrated a 2 µm diameter (FWHM) at its waist (indicated by vertical red line). The illumination FoV is also indicated (red horizontal bracket). Scale bar 10 µm. (B) Distributions and comparison of the measured FWHM of the Gaussian fits of beads close to the surface (N=11) and in the center (N=11) of the mounting lmpa cylinder. Values were measured along |
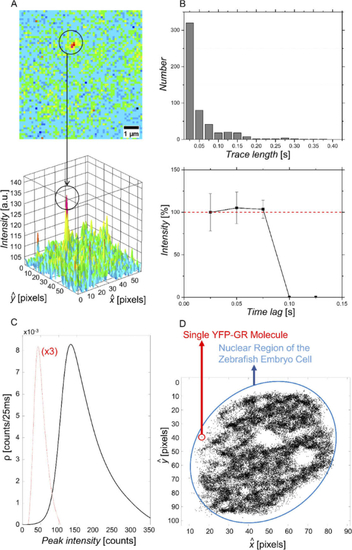
Characterization of detected fluorescence signals from individual YFP-GR molecules in fixed HEK293 cells. (A) Localization of a single fluorescent molecule. The circle indicates a fluorescence intensity spot that was attributed to an individual YFP molecule based on single-step photobleaching. (B) Top: Bar graph depicting the trace length of 1241 single molecules (521 traces) identified in images of fixed HEK293 cells. The average trace lengths equaled 2.3 frames, and approximately 85% of all traces consisted of 1-3 frames. Bottom: Time trace of the relative single-molecule fluorescence signals determined for all YFP-GR molecules showing a trace length of 1-3 frames. All traces show single-step photobleaching indicating that the signals can indeed be attributed to single YFP-GR molecules. (C) Density (ρ) plot representing the distribution of the peak intensity of 1241 fluorescence signals. The curve is nearly Gaussian-shaped with a maximum of 139.8 counts per 25 ms, corresponding to 22.3 photons. The signal intensity of the background is shown for comparison (dashed red line, density values are multiplied by 3 for better visualization) (D) Localization of single YFP-GR molecules in the nucleus of a nucleus in a living zebrafish embryo. The image depicts a representative localization of YFP-GR molecules, with an average of 19.6 ± 8.7 peaks per frame, accumulated from 3000 consecutive frames. Nucleoli are visible (white circular regions inside of the nucleus), in which YFP-GR molecules are not found. |
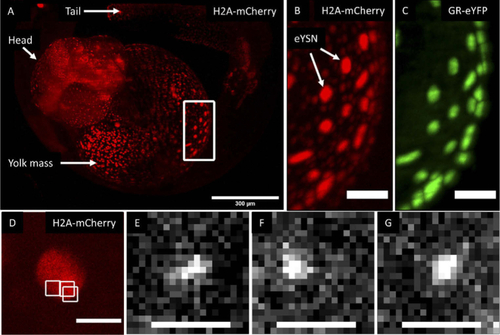
Imaging of YFP-GR in a zebrafish embryo. (A) Maximum intensity projection of a z-stack obtained using LSFM imaging of a developing 1dpf Tg(actb2:mCherry-H2A) zebrafish embryo injected with a YFP-GR expression vector (only H2A signal shown in A). Scale bar 300 µm. (B/C). Higher magnification image of the highlighted ROI showing the (B) mCherry-H2A and (C) the YFP-GR signal (maximum intensity projections, scale bars 50 µm). Imaging performed using a different LSFM setup. The expression of GR is evident, as well as the localization within the eYSN. (D) Image of a nuclei in the yolk from a 2dpf live zebrafish embryo obtained using the LSFSMM setup. Only H2A signal shown, scale bar 10 µm. (E-G) Three individual YFP-GR molecules imaged through the LSFSMM setup within the ROIs highlighted in D (white squares), in a 2 dpf zebrafish embryo. Scale bars 2 µm. |
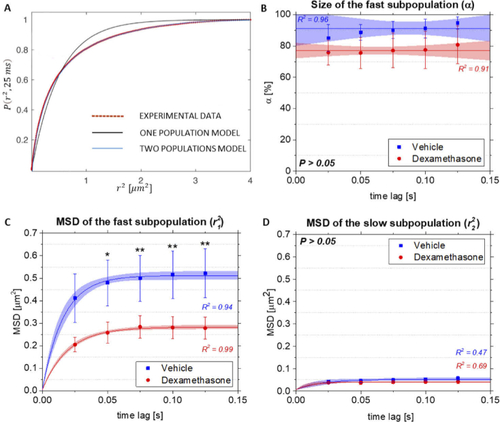
Analysis of the mobility pattern of YFP-GR in zebrafish embryos. Data obtained from three embryos from both the vehicle- (red) and dexamethasone-treated (blue) groups were pooled, and their averages with standard deviations are presented. (A) Cumulative probability P plot of squared displacement measurements r2, obtained experimentally for a time lag of 25 ms. Experimental data are best fitted using a two-population model, yielding the size of the fast subpopulation and the MSD for each time lag. Number of MSD replicates per time lag in each of the group equaled to 30. (B) Fast subpopulation fraction size in the vehicle-and dexamethasone-treated groups, fitted to a linear model with a fixed slope. P(t = 25 ms): 0.72, P(t = 50 ms): 0.49, P(t = 75 ms): 0.69, P(t = 100 ms): 0.92, P(t = 125 ms): 0.81. The 95% confidence interval and the standard deviation are shown. (C) MSD values for the fast subpopulation for the vehicle- and dexamethasone-treated groups, fitted using a confined diffusion model. The 95% confidence interval and the standard deviation are shown. P(t = 25 ms): 0.11, P(t = 50 ms): 0.02, P(t = 75 ms): < 0.01, P(t = 100 ms): < 0.01, P(t = 125 ms): < 0.01. (D) MSD values for the slow subpopulation for the vehicle- and dexamethasone-treated groups, fitted using a confined diffusion model. P(t = 25 ms): 0.15, P(t = 50 ms): 0.83, P(t = 75 ms): 0.24, P(t = 100 ms): 0.27, P(t = 125 ms): 0.42. The 95% confidence interval and the standard deviation are shown. For (B, C, D), Shapiro-Wilk test was performed to check if data is normally distributed. Significance of the results was conducted using a mixed-effect model for comparison of means between two normally distributed groups. Significant differences are indicated by an asterisk (Significance levels: P > 0.05, non-significant; P < 0.05, *; P < 0.01, **). Pearson’s correlation coefficients R2 of the model fitness are shown. |