IMAGE

Fig. 2

ID
ZDB-IMAGE-221212-32
Source
Figures for Bernardello et al., 2021
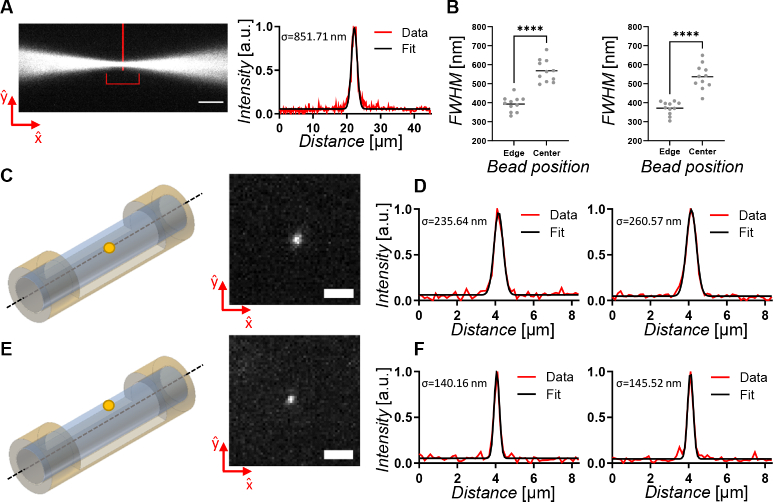
Image
Figure Caption

Fig. 2

LSFSMM system performances. (A) Illumination light beam focused by removal of the cylindrical lens. Measurement of the intensity profile through a Gaussian fit demonstrated a 2 µm diameter (FWHM) at its waist (indicated by vertical red line). The illumination FoV is also indicated (red horizontal bracket). Scale bar 10 µm. (B) Distributions and comparison of the measured FWHM of the Gaussian fits of beads close to the surface (N=11) and in the center (N=11) of the mounting lmpa cylinder. Values were measured along xˆ (left panel) and ŷ (right panel) direction. Shapiro-Wilk test was performed to check if data is normally distributed. Unpaired t-tests were then conducted to check for statistically significant difference between the two conditions and calculate two-tailed P-values. Horizontal bar represents the mean value, **** means P<0.0001. (C) Schematic of a 100 nm fluorescent bead positioned in the middle of a 0.5% lmpa cylinder and (D) normalized intensity profile measurement and Gaussian fit in xˆ (left panel) and ŷ (right panel) direction of an imaged bead. Scale bar 2 µm. (E) Schematic of a 100 nm fluorescent bead positioned close to the surface of a 0.5% lmpa cylinder and (F) normalized intensity profile measurement and Gaussian fit in xˆ (left panel) and ŷ (right panel) direction of an imaged bead. Scale bar 2 µm. For all the Gaussian fits here presented R2>0.96, and σ represents the standard deviation of the Gaussian curve.

Acknowledgments
This image is the copyrighted work of the attributed author or publisher, and ZFIN has permission only to display this image to its users. Additional permissions should be obtained from the applicable author or publisher of the image. Full text @ Biomed. Opt. Express