
Fig. 4
- ID
- ZDB-FIG-221212-34
- Publication
- Bernardello et al., 2021 - Analysis of intracellular protein dynamics in living zebrafish embryos using light-sheet fluorescence single-molecule microscopy
- Other Figures
- All Figure Page
- Back to All Figure Page
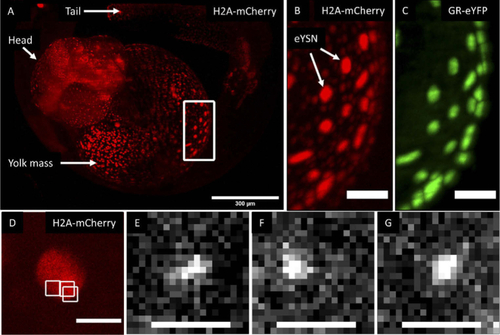
Imaging of YFP-GR in a zebrafish embryo. (A) Maximum intensity projection of a z-stack obtained using LSFM imaging of a developing 1dpf Tg(actb2:mCherry-H2A) zebrafish embryo injected with a YFP-GR expression vector (only H2A signal shown in A). Scale bar 300 µm. (B/C). Higher magnification image of the highlighted ROI showing the (B) mCherry-H2A and (C) the YFP-GR signal (maximum intensity projections, scale bars 50 µm). Imaging performed using a different LSFM setup. The expression of GR is evident, as well as the localization within the eYSN. (D) Image of a nuclei in the yolk from a 2dpf live zebrafish embryo obtained using the LSFSMM setup. Only H2A signal shown, scale bar 10 µm. (E-G) Three individual YFP-GR molecules imaged through the LSFSMM setup within the ROIs highlighted in D (white squares), in a 2 dpf zebrafish embryo. Scale bars 2 µm. |