
- Title
-
Sigma-1 Receptor Is Critical for Mitochondrial Activity and Unfolded Protein Response in Larval Zebrafish
- Authors
- Crouzier, L., Denus, M., Richard, E.M., Tavernier, A., Diez, C., Cubedo, N., Maurice, T., Delprat, B.
- Source
- Full text @ Int. J. Mol. Sci.
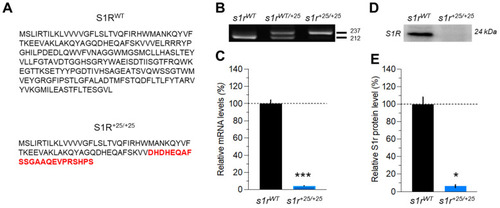
Characterization of the CRISPR/cas9-induced s1r mutant zebrafish line. (A) Amino acids sequence of the S1R protein with or without mutation. New inserted amino acids are depicted in red. (B) A targeted fragment was amplified by PCR from the genomic DNA of adult zebrafish tail and analyzed after migration on agarose gel. (C) Relative sigmar1 mRNA level revealed by qPCR in s1r+25/+25 and s1rWT zebrafish larvae. Expression of sigmar1 was normalized using the zef1α reference gene. (D) Representative Western blot of whole lysates from wild-type (s1rWT) or homozygous s1r+25/+25 mutant zebrafish. (E) Relative S1R protein level in the whole larvae at 5 dpf, normalized using total protein expression in the samples (Stain-Free™). Data are shown as the mean ± SEM from n = 12 per group in (C) and n = 4 in (E). * p < 0.05, *** p < 0.001 vs. s1rWT controls; Man n-Whitney’s test. |
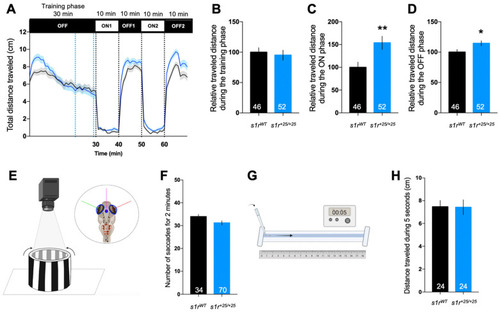
Behavioral analyses of 5 dpf s1r mutant larvae. (A) Analysis of the distance traveled by the larvae during the light/dark (intensity 100%/0%) cycle in the VMR test. The activity was measured for 70 min with a training phase of 30 min in the dark (OFF 0%), then two cycles of light/dark (ON 100%/OFF 0%) of 10 min each. The graph shows the distance traveled per min for s1rWT and s1r+25/+25 larvae. (B) Relative distance traveled during the training phase [blue dotted lines in (C), between 21 and 29 min]; (A) during the ON phase [the averaged ON1 and ON2 phases]; (D) during the OFF phase [the averaged OFF1 and OFF2 phases]. Relative distance was expressed as % of controls. (E) Illustration of the OKR test. (F) Quantification of the number of saccades performed in 2 min. (G) Illustration of the touch escape test. The larva was placed in a rail filled with E3 medium, the tail was touched with a tip and the distance was measured. (H) The distance traveled was measured during 5 s, repeated three times per larva and averaged. Data show mean ± SEM from three replicas. The number of animals is indicated within the columns. * p < 0.05, ** p < 0.01; unpaired t-test. PHENOTYPE:
|
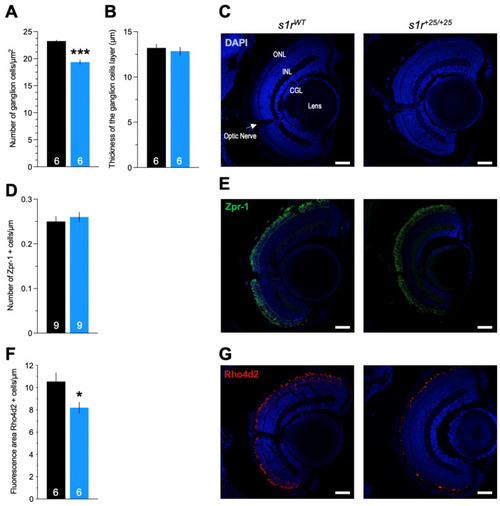
Morphological analysis of the neurons in the zebrafish retina. (A) Quantification of the number of ganglion cells, (B) quantification of the thickness of the associated layer, and (C) typical micrographs of the retina. Confocal images were obtained from section from s1rWT and s1r+25/+25 zebrafish retina, showing cell nuclei labeled with 4′,6-diamidino-2-phenylindole (DAPI, blue). (D) Quantification of photoreceptor cells (red and green cones) labelled with Zpr-1 antibody and (E) typical micrographs of the cones (green). (F) Quantification of rods labelled with Rho4d2 antibody and (G) typical micrographs of the rods (red). Abbreviations: GCL, ganglion cell layer; INL, inner nuclear layer; ONL, outer nuclear layer. Scale bars in (C,E,G) = 30 µm. The number of animals is indicated in the columns. * p < 0.05, *** p < 0.001; unpaired t-test. |

Related mRNA and protein expression levels of ER stress markers in zebrafish larvae in physiological conditions at 5 dpf. (A) mRNA levels were analyzed by qPCR in whole larvae. (B) Protein contents were analyzed by Western blot. (C) Representative Western blots. zeif2α level and Stain-Free™ were used as a loading control in qPCR and Western blot analyses, respectively. Data are expressed as mean ± SEM, normalized to s1rWT control level with n = 5–9 in each group. * p < 0.05, ** p < 0.01, *** p < 0.001; unpaired t-test. |
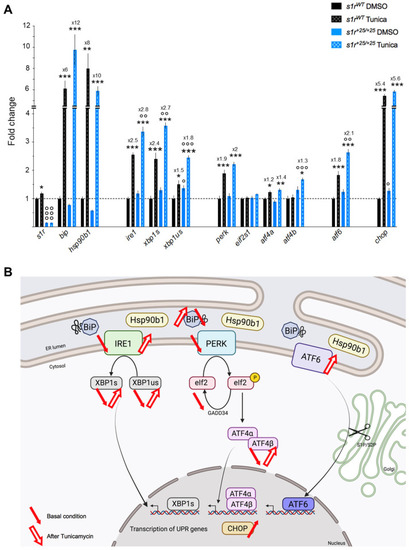
(A) Effect of the Tunicamycin (2 µg/mL, 24 h) challenge on ER stress gene expression levels in s1r+25/+25 zebrafish larvae at 5 dpf. The selected genes were analyzed using cDNA prepared from whole zebrafish larvae and relative mRNA expression were expressed as percentage of s1rWT + 0.1% DMSO controls. The fold change from 0.1% DMSO treatment is indicated. Data are expressed in mean ± SEM of n = 5 determination in each group. * p < 0.05, ** p < 0.01, *** p < 0.001 vs. DMSO treatment; ° p < 0.05, °° p < 0.01, °°° p < 0.001 vs. s1rWT line; two-way ANOVA followed by unpaired t-test. (B) Schematic summary of ER stress pathway alterations observed in basal condition or after tunicamycin treatment in s1r+25/+25 zebrafish line. |
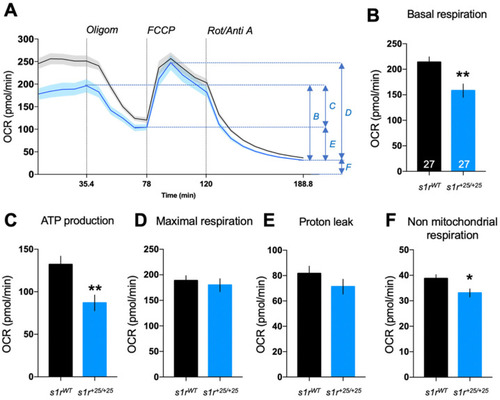
Analysis of mitochondrial respiration by the zebrafish larvae at 5 dpf analyzed using the Seahorse XF mito stress test. (A) Seahorse diagram depicting profile of oxygen consumption rate (OCR) during the assay. Letters (B–F) indicate the OCR components detailed in panels (B–F). (B) Basal respiration, (C) ATP production, (D) maximal respiration, (E) proton leak, (F) non-mitochondrial respiration. Data are shown as mean ± SEM from the number of larvae indicated in (B). Abbreviations: Oligom, oligomycin (25 μM); FCCP, carbonyl cyanide-p-trifluoromethoxyphenylhydrazone (8 μM); Rot/Anti A, rotenone + antimycin A (15 μM). * p < 0.05, ** p < 0.01; unpaired t-test. PHENOTYPE:
|

Effect of the Tunicamycin (Tun, 2 µg/mL, 24 h) challenge on mitochondrial respiration of the zebrafish larvae at 5 dpf analyzed using the Seahorse XF mito stress test. (A) Profiles of oxygen consumption rate (OCR) during the assay. (B) Basal respiration, (C) ATP production, (D) maximal respiration, (E) proton leak, (F) non-mitochondrial respiration. Data are shown as mean ± SEM from the number of larvae indicated in (B). Abbreviations: Oligom, oligomycin (25 μM); FCCP, carbonyl cyanide-p-trifluoromethoxyphenylhydrazone (8 μM); Rot/Anti A, rotenone + antimycin A (15 μM). ** p < 0.01, *** p < 0.001 vs. V-treated; °°° p < 0.001 vs. s1rWT; Newman-Keuls’ test after a two-way ANOVA. PHENOTYPE:
|