
Figure 5
|
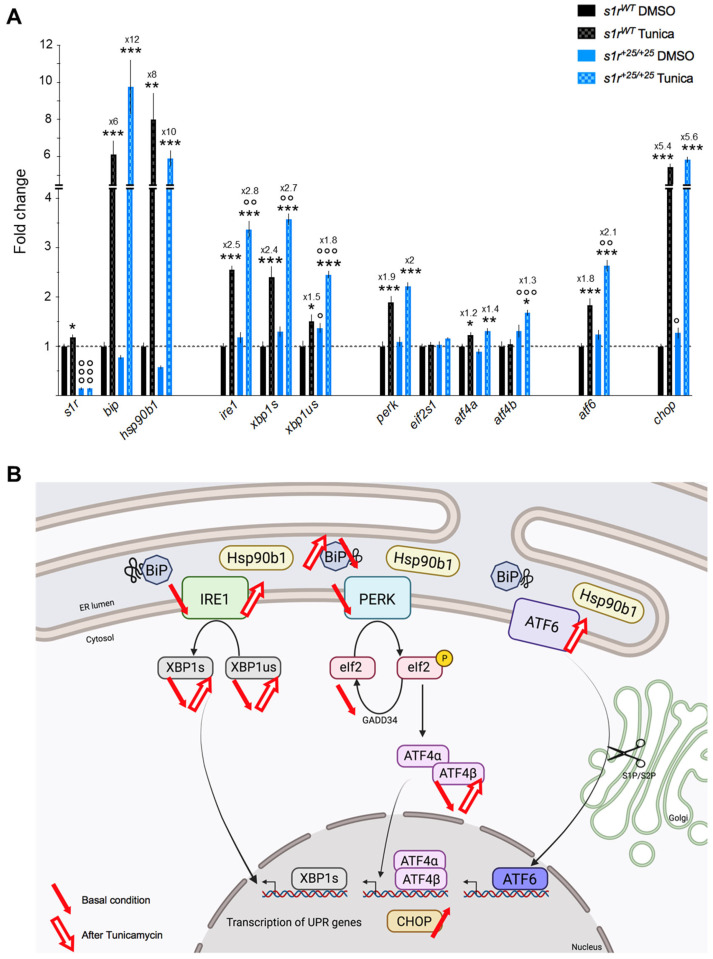
Figure 5 (A) Effect of the Tunicamycin (2 µg/mL, 24 h) challenge on ER stress gene expression levels in s1r+25/+25 zebrafish larvae at 5 dpf. The selected genes were analyzed using cDNA prepared from whole zebrafish larvae and relative mRNA expression were expressed as percentage of s1rWT + 0.1% DMSO controls. The fold change from 0.1% DMSO treatment is indicated. Data are expressed in mean ± SEM of n = 5 determination in each group. * p < 0.05, ** p < 0.01, *** p < 0.001 vs. DMSO treatment; ° p < 0.05, °° p < 0.01, °°° p < 0.001 vs. s1rWT line; two-way ANOVA followed by unpaired t-test. (B) Schematic summary of ER stress pathway alterations observed in basal condition or after tunicamycin treatment in s1r+25/+25 zebrafish line.