
- Title
-
Differential expression and hypoxia-mediated regulation of the N-myc downstream regulated gene family
- Authors
- Le, N., Hufford, T.M., Park, J.S., Brewster, R.M.
- Source
- Full text @ FASEB J.
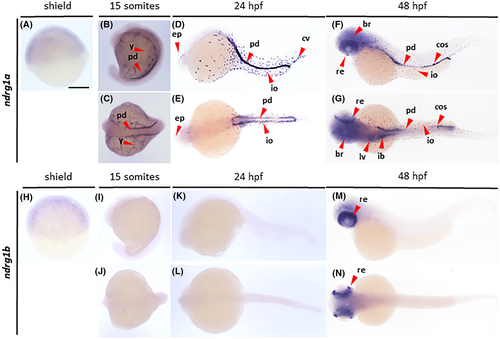
Gene expression analysis of ndrg1. Wholemount in situ hybridization analysis revealing the distribution of ndrg1a (A–G) and ndrg1b (H–N) transcripts in zebrafish embryos at shield (A, H), 15 somites (B, C, I, J), 24 hpf (D, E, K, L) and 48 hpf (F, G, M, N) stages, imaged from lateral (A, B, D, F, H, I, K, M) and dorsal (C, E, G, J, L, N) views. br, brain; cos, corpuscles of Stannius; cv, caudal vein; ep, epiphysis; ib, intestinal bulb; io, ionocyte; lv, liver; pd, pronephric ducts; re, retina; y, yolk. Scale bar, 250 μm |
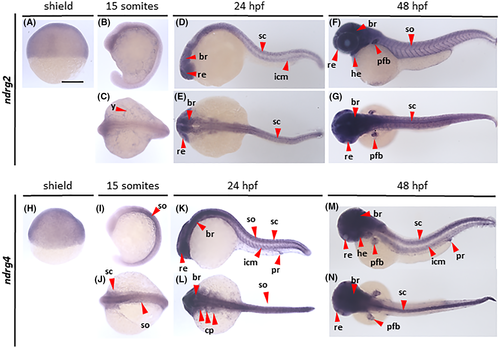
Gene expression analysis of ndrg2 and ndrg4. Wholemount in situ hybridization analysis revealing the distribution of ndrg2 (A–G) and ndrg4 (H–N) transcripts in zebrafish embryos at shield (A, H), 15 somites (B, C, I, J), 24 hpf (D, E, K, L, J) and 48 hpf (F, G, M, N) stages, imaged from lateral (A, B, D, F, H, I, K, M) and dorsal (C, E, G, J, L, N) views. br, brain; cp, cranial placodes; he, heart; icm, intermediate cell mass of mesoderm; pfb, pectoral fin buds; pr, proctodeum; re, retina; sc, spinal cord; so, somites. Scale bar, 250 μm |
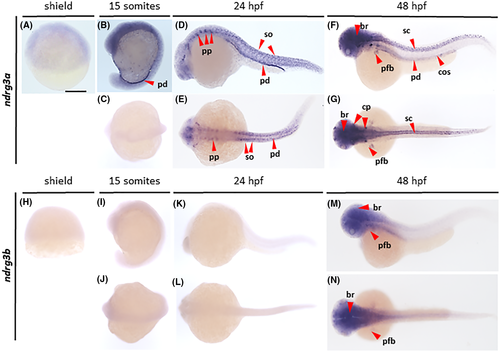
Gene expression analysis of ndrg3. Wholemount in situ hybridization analysis revealing the distribution of ndrg3a (A–G) and ndrg3b (H–N) transcripts in zebrafish embryos at shield (A, H), 15 somites (B, C, I, J), 24 hpf (D, E, K, L) and 48 hpf (F, G, M, N) stages, imaged from lateral (A, B, D, F, H, I, K, M) and dorsal (C, E, G, J, L, N) views. br, brain; cos, corpuscles of Stannius; cp, cranial placodes; pfb, pectoral fin buds; pp, pharyngeal pouches; pd, pronephric ducts; sc, spinal cord; so, somites. Scale bar, 250 μm |
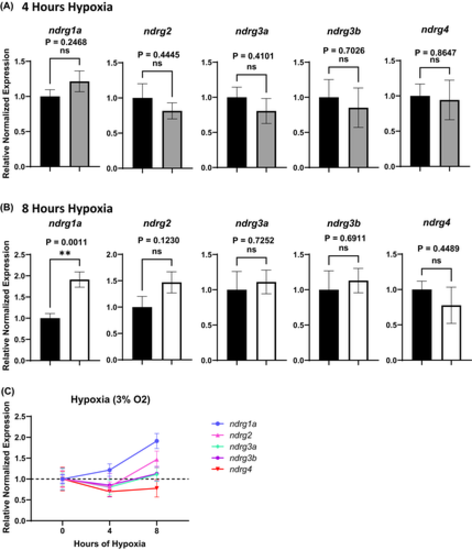
Changes in ndrg transcript levels in response to hypoxia (3% oxygen). (A, B) Real-time qPCR analysis of 24 hpf zebrafish embryos exposed to 4 h (A, grey bars) or 8 h (B, white bars) of hypoxia relative to normoxic (stage-matched) controls (A, B, black bars) normalized to ef1a. (C) Plotted graphical summary of qPCR results. The y-axis in the graphs represents the relative normalized expression of each gene. All fold changes were derived using the formula, 2−(ΔΔCT), error bars represent standard error of the mean. Significance was obtained using the unpaired, two-tailed t-test with Welch’s Correction. **p < .01. Reactions were run in triplicate with 7–8 biological replicates (n = 7–8). |
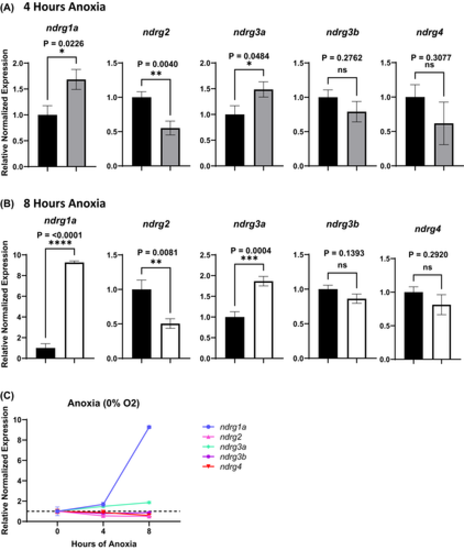
Changes in ndrg transcript levels in response to anoxia. Real-time qPCR analysis of 24 hpf zebrafish embryos exposed to 4 h (A, grey bars) or 8 h (B, white bars) of anoxia relative to normoxic (stage-matched) controls (A, B, black bars) normalized to ef1a. (C) Plotted graphical summary of qPCR results. The y-axis in the graphs represents the relative normalized expression of each gene. All fold changes were derived using the formula, 2−(ΔΔCT), error bars represent standard error of the mean. Significance was obtained using the unpaired, two-tailed t-test with Welch’s Correction. *p < .05, **p < .01, ***p < .0005, ****p < .0001. Reactions were run in triplicate with 7–8 biological replicates (n = 7–8) |

Analysis of ndrg1a expression in zebrafish embryos following 8 h of anoxia. Wholemount in situ hybridization analysis revealing the distribution of ndrg1a transcript in 24 hpf zebrafish embryo exposed to 8 h of anoxia (B–B″, C–C′, D–D′, F–F″, H, J) relative to normoxic (stage-matched controls) (A–A″, E–E″, G, I) imaged from a lateral view (A–D′), a dorsal view (E–F″) and cross-sectional (G–J) views through the otic vesicles (G,H) and the trunk (I,J). (A′–B″, E–F″ are magnified views of (A,B,E,F). The mild (C,C′) and severe (D,D′) transcriptional responses are included to compare with the moderate response (B–B″, F–F″). aa, aortic arch; cp, cranial placodes; cv, caudal vein; da, dorsal aorta; ep, epiphysis; hgc, hatching gland cells; io, ionocyte; llp, lateral line primordium; mcev, mid-cerebral vein; ov, otic vesicle; pcv, posterior cardinal vein; pmbc, primordial midbrain channel; pd, pronephric ducts; so, somites. The experiment was repeated in triplicate, with eight embryos representative of the group imaged. Scale bar in A,A′, 250 μm. Scale bar in G,I, 50 μm |

ZFIN is incorporating published figure images and captions as part of an ongoing project. Figures from some publications have not yet been curated, or are not available for display because of copyright restrictions. |