
Image
|
Figure Caption
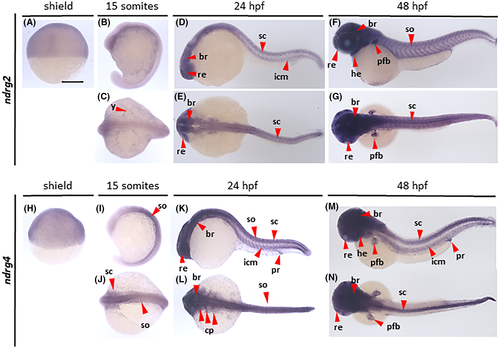
Fig. 2 Gene expression analysis of ndrg2 and ndrg4. Wholemount in situ hybridization analysis revealing the distribution of ndrg2 (A–G) and ndrg4 (H–N) transcripts in zebrafish embryos at shield (A, H), 15 somites (B, C, I, J), 24 hpf (D, E, K, L, J) and 48 hpf (F, G, M, N) stages, imaged from lateral (A, B, D, F, H, I, K, M) and dorsal (C, E, G, J, L, N) views. br, brain; cp, cranial placodes; he, heart; icm, intermediate cell mass of mesoderm; pfb, pectoral fin buds; pr, proctodeum; re, retina; sc, spinal cord; so, somites. Scale bar, 250 μm
Figure Data
Acknowledgments
This image is the copyrighted work of the attributed author or publisher, and
ZFIN has permission only to display this image to its users.
Additional permissions should be obtained from the applicable author or publisher of the image.
Full text @ FASEB J.