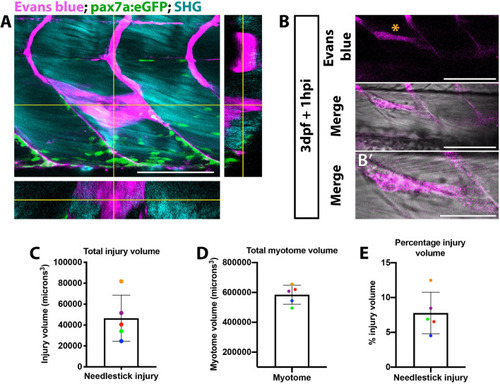
Visualization of muscle injury using Evans blue reveals low variability of injury size caused by needlestick. Evans blue labeling of damaged muscle (A,B) was visualized on a multiphoton microscope and localizes with perturbed myofibre morphology (B’) at needlestick wounds (asterisk) in 3 dpf larvae at 1 h post-injury. Maximum projection (A) with orthogonal sections in planes YZ (right) and XZ (bottom) showing Evans blue staining relative to myofibres (visualized by second harmonic generation; SHG) and pax7a:eGFP expressing muSCs. Volumetric measure of the (C) total myotome and (D) injured region were calculated by measuring injury size for each section, and the percentage injury size of the total myotome calculated (E). Each larvae (n = 5) has been color coded to highlight the variance in myotome and injury size. Error bars display standard deviation. Scale bars: 100 μm (A,B), 50 μm (B’).

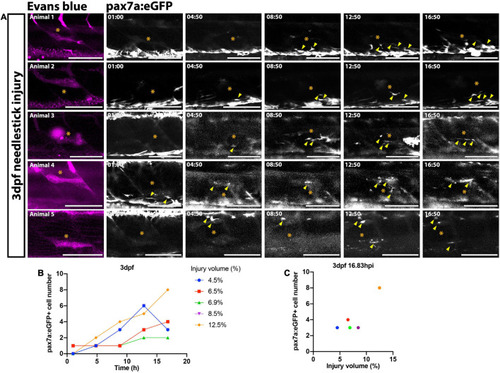
FIGURE 2. Time-lapsed imaging reveals the extent of the muSC response is related to the injury size. Images from time-lapsed movies reveal pax7a:eGFP-expressing muSCs (arrowheads) respond to injury (asterisk) labeled with Evans Blue (magenta) in the myotome of five representative 3 dpf larvae (A, animals 1–5). Images were acquired on a multiphoton microscope and maximum intensity projections generated. The number of pax7a:eGFP+ cells in the myotome was quantified and plotted against time (B) and injury volume (C). Each colored line (B) or dot (C) represents a single animal. Scale bars: 100 μm (A).

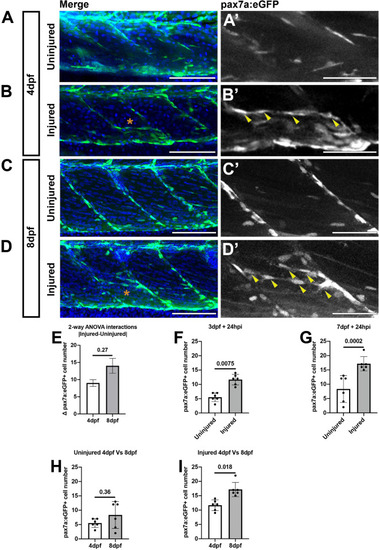
Muscle injury results in an increased number of pax7a:egfp-expressing cells within the myotome at 3 and 7 dpf. Projections of confocal z-stacks of the myotome in uninjured (A,C) and injured (B,D) 3 or 7 dpf pax7a:eGFP larvae at 24 hpi with nuclei labeled with DAPI. MuSCs (arrowheads) are recruited to the site of injury (asterisk) and align with myofibres at both stages (A’–D’). Quantification of pax7a:egfp-expressing muSCs in uninjured and injured 3 and 7 dpf larvae at 24 hpi. The magnitude of change to the number of muSCs responding to injury (Δpax7a:egfp+) is significantly different between 4 and 8 dpf larvae (p > 0.05, E). Pairwise comparisons reveals a significant increase in the number of muSCs at both stages as a consequence of injury (p < 0.05, F,G). There is no significant difference in the number of muSCs between uninjured animals at 4 and 8 dpf (H), but there are more muSCs in injured 8 dpf larvae relative to injured 4 dpf larvae (p < 0.05, I). Significant differences were tested by 2-way ANOVA (n = 47) with Tukey’s HSD post hoc test. Error bars represent standard deviation, and values above comparison bars represent significance (p-values). Scale bars: 100 μm (A–D), 50 μm (A’–D’).

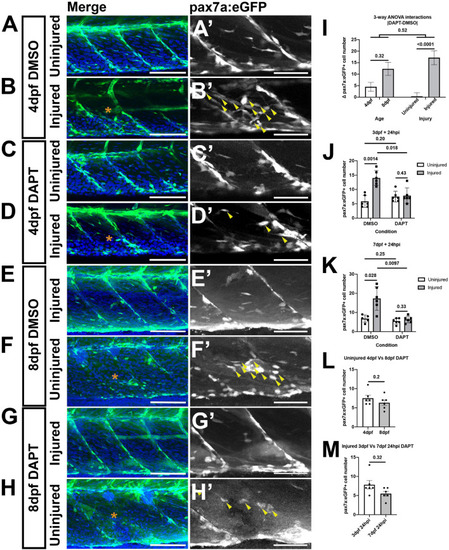
A loss of Notch activity attenuates the muSC response to injury. Projections of confocal stacks of the myotome in uninjured (A,C,E,G) and injured (B,D,F,H) pax7a:eGFP larvae at 3 dpf (A–D) or 7 dpf (E–H). Animals were treated with 1% v/v DMSO (A,B,E,F) or 100 μM DAPT (C,D,G,H) prior to and after injury, fixed at 24 hpi and nuclei labeled with DAPI. There are more muSCs expressing eGFP (arrowheads) recruited to the injury (asterisk) in DMSO treated larvae (B’,F’) compared to DAPT treated larvae (D’,H’). Quantification of pax7a:egfp-expressing muSCs in uninjured and injured 3 and 7 dpf larvae treated with DMSO or DAPT. Tests for significant differences in muSC number due to injury, DAPT or age revealed that injury affected the number of muSCs present (p < 0.05), but DAPT treatment nor developmental stage did (p > 0.05, I). Pairwise comparisons revealed that injury-induced changes to the number of muSCs is attenuated by treatment with DAPT (p < 0.05, J,K). There is no significant difference in the number of muSCs in the myotome of uninjured 4 and 8 dpf larvae treated with DAPT (p > 0.05, L). Likewise, there is no difference of muSC number in the myotome of injured 4 and 8 dpf larvae treated with DAPT (p > 0.05, M). Significant differences were tested by 3-way ANOVA following transformation by ART (n = 47) and post hoc tests performed using a Dunn’s test with Benjamini and Hochberg correction. Error bars represent standard deviation, and values above comparison bars represent significance (p-values). Scale bars: 100 μm (A–H), 50 μm (A’–H’).

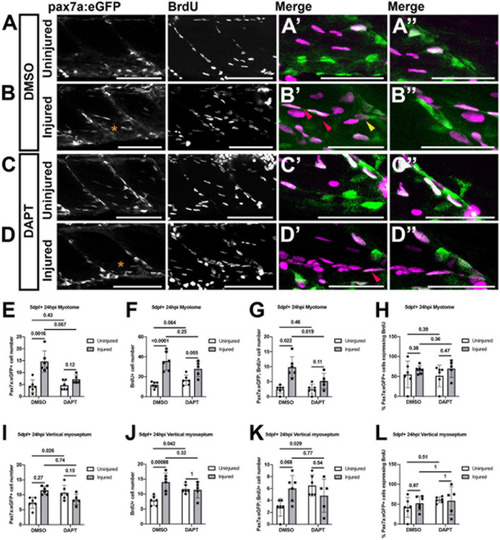
Proliferation of muSCs during regeneration and homeostasis is Notch dependent. Projections of confocal stacks (A–D) of the myotome (A’–D’) and vertical myoseptum (A”–D”) in uninjured (A,C) and injured (B,D) 5 dpf pax7a:eGFP larvae incubated with BrdU for 24 h. Larvae were treated with 1% v/v DMSO (A,B) or 100 μM DAPT (C,D) after injury and detection of BrdU and eGFP was performed by immunolabeling. MuSCs with (red arrowheads) and without BrdU labeling (yellow arrowheads) are recruited to the injury (asterisk) site (B’,D’). The number of cells expressing pax7a:eGFP (E,I), incorporating BrdU (F,J) or both (G,K) were counted in the myotome (E–G) and both vertical myoseptum (I–K) of animals treated with DMSO or DAPT. The proportion of pax7a:eGFP-expressing muSCs incorporating BrdU was calculated for both myotome (H) and vertical myoseptum (L). There were significantly fewer GFP+ muSCs incorporating BrdU after injury in the presence of DAPT compared to DMSO treated control animals (p < 0.05; G). There is no significant change to the number of GFP+ muSCs incorporating BrdU at the vertical myoseptum of injured animals in the presence of DAPT (p > 0.05; K). In contrast, although there are only few cells present, there is a significant increase in the number of muSCs with BrdU labeling at the myoseptum in uninjured animals in the presence of DAPT (p < 0.05; K). Significant differences were tested by 2-way ANOVA (n = 23) with Tukey’s HSD post hoc test or by transforming data by ART and performing 2-way ANOVA followed by a Dunn’s test with Benjamini and Hochberg correction. Error bars display standard deviation, and values above comparison bars indicate significance (p-values). Scale bars: 100 μm (A–D), 50 μm (A’–D’,A’–D”).

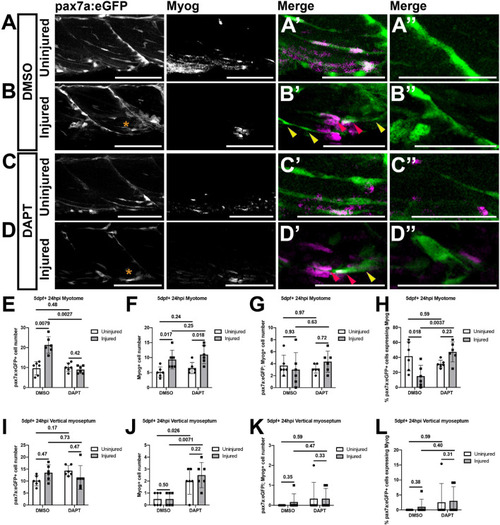
Inhibition of Notch signaling results in an increased differentiation of muSCs responding to injury. Projections of confocal stacks (A–D) of the myotome (A’–D’) and vertical myoseptum (A”–D”) of 5 dpf pax7a:eGFP larvae treated with 1% DMSO (A,B) or 100 μM DAPT (C,D) prior to (A,C) and after injury (B,D), fixed at 24 hpi and labeled with anti-Myogenin. pax7a:GFP expressing muSCs with (red arrowheads) and without Myogenin labeling (yellow arrowheads) are recruited to the injury (asterisk) site (B’,D’). Quantification of pax7a:egfp expressing muSCs (E,I), Myogenin expressing cells (F,J) and co-labeled cells (G,K) in the myotome (G,H) and both vertical myoseptum (I–K) reveals no significant difference in the number of muSCs expressing Myogenin in DAPT treated compared to DMSO treated animals (p > 0.05, G,K). Examination of the proportion of pax7a:eGFP expressing muSCs expressing Myogenin in the myotome (H) and vertical myoseptum (L) reveals a significantly increase in those expressing Myogenin in the presence of DAPT following injury in the myotome (p < 0.05, H). Significant differences were tested by 2-way ANOVA (n = 24) with Tukey’s HSD post hoc test or by transforming data by ART and performing 2-way ANOVA followed by a Dunn’s test with Benjamini and Hochberg correction. Errors bars display standard deviation and values above bars indicate significance (p-values). Scale bars: 100 μm (A–D), 50 μm (A’–D’,A”–D”).

Acknowledgments
This image is the copyrighted work of the attributed author or publisher, and ZFIN has permission only to display this image to its users. Additional permissions should be obtained from the applicable author or publisher of the image. Full text @ Front Cell Dev Biol