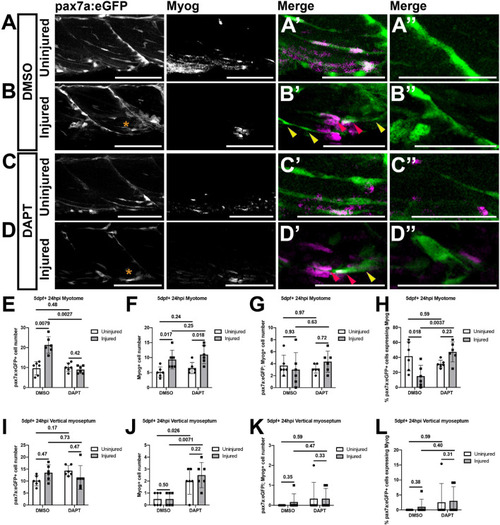
Inhibition of Notch signaling results in an increased differentiation of muSCs responding to injury. Projections of confocal stacks (A–D) of the myotome (A’–D’) and vertical myoseptum (A”–D”) of 5 dpf pax7a:eGFP larvae treated with 1% DMSO (A,B) or 100 μM DAPT (C,D) prior to (A,C) and after injury (B,D), fixed at 24 hpi and labeled with anti-Myogenin. pax7a:GFP expressing muSCs with (red arrowheads) and without Myogenin labeling (yellow arrowheads) are recruited to the injury (asterisk) site (B’,D’). Quantification of pax7a:egfp expressing muSCs (E,I), Myogenin expressing cells (F,J) and co-labeled cells (G,K) in the myotome (G,H) and both vertical myoseptum (I–K) reveals no significant difference in the number of muSCs expressing Myogenin in DAPT treated compared to DMSO treated animals (p > 0.05, G,K). Examination of the proportion of pax7a:eGFP expressing muSCs expressing Myogenin in the myotome (H) and vertical myoseptum (L) reveals a significantly increase in those expressing Myogenin in the presence of DAPT following injury in the myotome (p < 0.05, H). Significant differences were tested by 2-way ANOVA (n = 24) with Tukey’s HSD post hoc test or by transforming data by ART and performing 2-way ANOVA followed by a Dunn’s test with Benjamini and Hochberg correction. Errors bars display standard deviation and values above bars indicate significance (p-values). Scale bars: 100 μm (A–D), 50 μm (A’–D’,A”–D”).
|
