IMAGE

FIGURE 3

ID
ZDB-IMAGE-211021-3
Source
Figures for Sultan et al., 2021
Image
Figure Caption

FIGURE 3

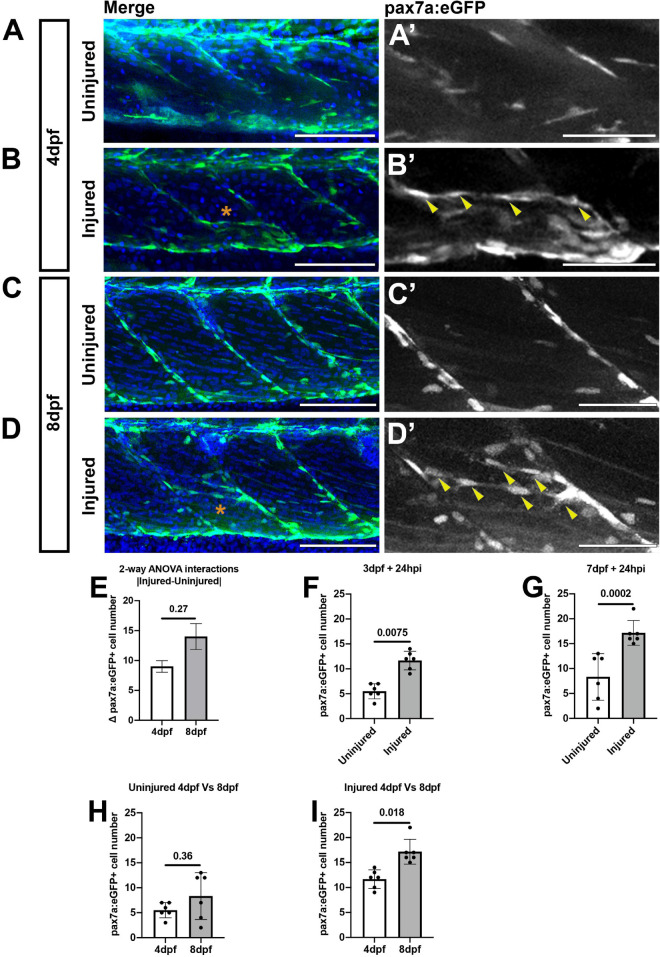
Muscle injury results in an increased number of pax7a:egfp-expressing cells within the myotome at 3 and 7 dpf. Projections of confocal z-stacks of the myotome in uninjured (A,C) and injured (B,D) 3 or 7 dpf pax7a:eGFP larvae at 24 hpi with nuclei labeled with DAPI. MuSCs (arrowheads) are recruited to the site of injury (asterisk) and align with myofibres at both stages (A’–D’). Quantification of pax7a:egfp-expressing muSCs in uninjured and injured 3 and 7 dpf larvae at 24 hpi. The magnitude of change to the number of muSCs responding to injury (Δpax7a:egfp+) is significantly different between 4 and 8 dpf larvae (p > 0.05, E). Pairwise comparisons reveals a significant increase in the number of muSCs at both stages as a consequence of injury (p < 0.05, F,G). There is no significant difference in the number of muSCs between uninjured animals at 4 and 8 dpf (H), but there are more muSCs in injured 8 dpf larvae relative to injured 4 dpf larvae (p < 0.05, I). Significant differences were tested by 2-way ANOVA (n = 47) with Tukey’s HSD post hoc test. Error bars represent standard deviation, and values above comparison bars represent significance (p-values). Scale bars: 100 μm (A–D), 50 μm (A’–D’).

Acknowledgments
This image is the copyrighted work of the attributed author or publisher, and ZFIN has permission only to display this image to its users. Additional permissions should be obtained from the applicable author or publisher of the image. Full text @ Front Cell Dev Biol