IMAGE

FIGURE 1

ID
ZDB-IMAGE-211021-2
Source
Figures for Sultan et al., 2021
Image
Figure Caption

FIGURE 1

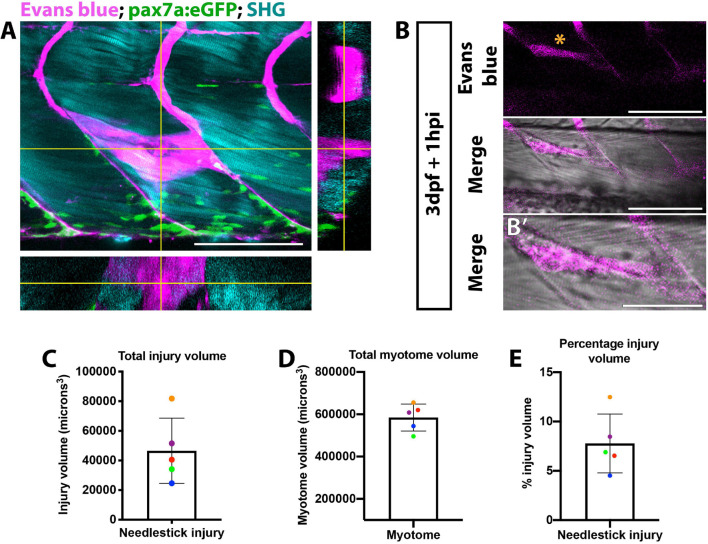
Visualization of muscle injury using Evans blue reveals low variability of injury size caused by needlestick. Evans blue labeling of damaged muscle (A,B) was visualized on a multiphoton microscope and localizes with perturbed myofibre morphology (B’) at needlestick wounds (asterisk) in 3 dpf larvae at 1 h post-injury. Maximum projection (A) with orthogonal sections in planes YZ (right) and XZ (bottom) showing Evans blue staining relative to myofibres (visualized by second harmonic generation; SHG) and pax7a:eGFP expressing muSCs. Volumetric measure of the (C) total myotome and (D) injured region were calculated by measuring injury size for each section, and the percentage injury size of the total myotome calculated (E). Each larvae (n = 5) has been color coded to highlight the variance in myotome and injury size. Error bars display standard deviation. Scale bars: 100 μm (A,B), 50 μm (B’).

Acknowledgments
This image is the copyrighted work of the attributed author or publisher, and ZFIN has permission only to display this image to its users. Additional permissions should be obtained from the applicable author or publisher of the image. Full text @ Front Cell Dev Biol