FIGURE SUMMARY
Title

Yap Regulates Müller Glia Reprogramming in Damaged Zebrafish Retinas

Authors
Lourenço, R., Brandão, A.S., Borbinha, J., Gorgulho, R., Jacinto, A.
Source
Full text @ Front Cell Dev Biol

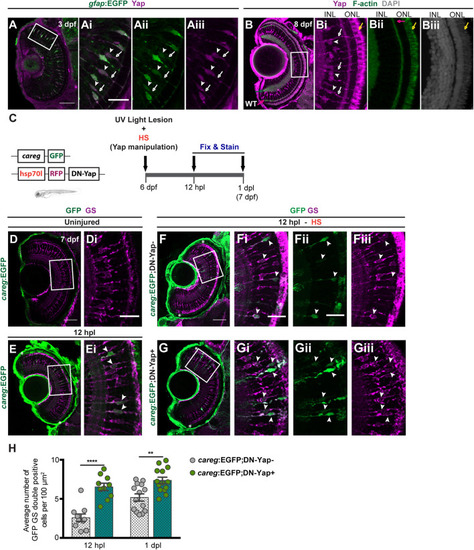
Yap inhibition induces accumulation of activated Müller glial cells (MGs) upon photoreceptor-induced light lesion. (A) Transverse cryosection of a Tg(gfap:GFP) 3-dpf retina immunostained for green fluorescent protein (GFP) (green, Ai) and Yap (magenta, Aii), indicating Yap localization in MG cell bodies (arrowheads) and radial processes (arrows) (Ai–Aiii). (B) Transverse cryosection of a WT 8-dpf retina immunostained for Yap (magenta, B,Bi) and F-actin (green, B,Bii) and counterstained with DAPI (gray, Biii), indicating photoreceptors outer-segment autofluorescence (yellow arrow). (C) Schematic representation of the UV light lesion assay. (D,E) Transverse cryosections of uninjured 7-dpf careg-EGFP (D,Di) and 12-hpl careg-EGFP (E,Ei) larva retinas immunostained for GFP (green) and glutamine synthetase (GS) (magenta). White arrowheads indicate GFP-positive MGs activating careg (E, magnified, Ei). (F,G) Transverse cryosections of 12-hpl careg:EGFP;DN-Yap− controls (F-Fiii) and careg:EGFP;DN-Yap+ (G-Giii) retinas immunostained for GFP (green) and GS (magenta). White arrowheads indicate GFP-positive MGs activating careg. (H) Quantification of the number of double GFP GS-positive cells in careg:EGFP;DN-Yap− controls and careg:EGFP;DN-Yap + larva retinas from 12 hpl to 1 dpl. **p < 0.01, ****p < 0.0001; unpaired t-test with Welch’s correction. White boxes delimitate magnified (Ai–Giii). Green arrow indicates the inner plexiform layer. Pink arrow indicates the outer plexiform layer. Scale bars correspond to 50 μm in (A,D,F) and 20 μm in magnified (Ai,Di,Fi). Asterisks delimitate the lesioned region.

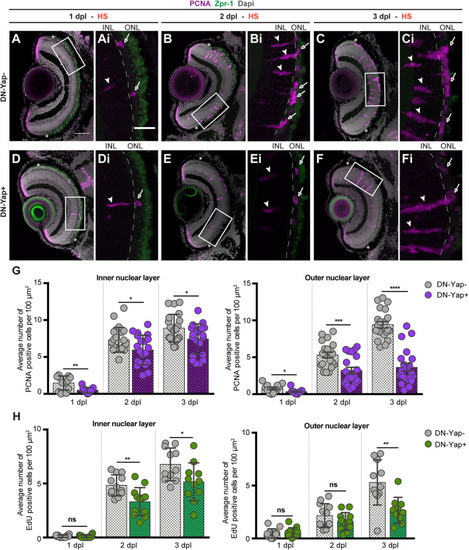
Yap inhibition reduces cell proliferation in the retina after photoreceptor-induced light lesion. (A–F) Transverse cryosections of DN-Yap− (A–C) and DN-Yap+ (D–F) retinas immunostained for proliferating cell nuclear antigen (PCNA) (magenta) and Zpr-1 (green) and counterstained with DAPI (gray). White arrowheads and arrows indicate PCNA+ cells in the inner nuclear layer (INL) and outer nuclear layer (ONL), respectively, at 1 dpl (A,D magnified, Ai,Di), 2 dpl (B,E, magnified, Bi,Ei), and 3 dpl (C,F, magnified, Ci,Fi). (G) Quantification of PCNA + cells in DN-Yap− and DN-Yap + larva retinas from 1 to 3 dpl, in the INL and ONL. (H) Quantification of EdU + cells in DN-Yap− and DN-Yap + larva retinas from 1 to 3 dpl, in the INL and ONL. ns, non-significant; *p < 0.05, **p < 0.01, ***p < 0.001, ****p < 0.0001. Unpaired t-test with Welch’s correction. Asterisks delimitate the lesioned region. Dashed lines delimitate INL from ONL. White boxes delimitate magnified (Ai–Fi). Scale bars correspond to 50 μm in (A,C), and 20 μm in magnified (Ai,Ci).

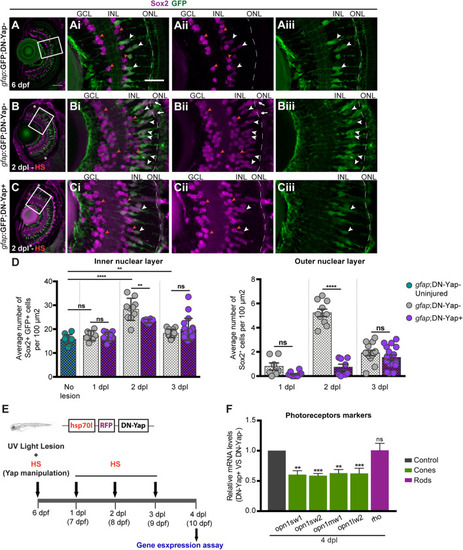
Yap is required to regulate the number of Sox2-positive Müller glia cell (MG) progenitor cells and expression of photoreceptor markers after photoreceptor-induced light lesion. (A–C) Transverse cryosections of uninjured 6-dpf gfap:GFP;DN-Yap− control retina (A), 2-dpl gfap:GFP;DN-Yap− (B) and gfap:GFP;DN-Yap+ (C) retinas subjected to UV light lesion and heat shock (HS) at 6 dpf, immunostained for Sox2 (magenta) and green fluorescent protein (GFP) (green). Sox2 is localized in amacrine cells (ACs) (orange arrowheads) (magnified, Ai,Aii,Bi,Bii,Ci,Cii), MGs (white arrowheads), and progenitors in the outer nuclear layer (ONL) (white arrows) (magnified, Ai–Aiii,Bi–Biii,Ci–Ciii). (D) Quantification of Sox2 + GFP + cells in gfap:GFP;DN-Yap− uninjured controls at 6 dpf, and lesioned gfap:GFP;DN-Yap− and gfap:GFP;DN-Yap + larva retinas from 1 to 3 dpl, in inner nuclear layer (INL) and ONL. (E) Schematic representation of the UV light lesion and HS assay. (F) Relative gene expression of photoreceptor markers at 4 dpl (n = 7 biological replicates) in DN-Yap + versus DN-Yap− controls. ns, non-significant; **p < 0.01, ***p < 0.001, ****p < 0.0001. Unpaired t-test with Welch’s correction for Sox2+ cell quantification. Paired t-test for the relative gene expression of photoreceptor markers. Asterisks delimitate the lesioned region. Dashed lines delimitate INL from ONL. White boxes delimitate magnified (Ai–Aiii,Bi–Biii,Ci–Ciii). Scale bars correspond to 50 μm in (A) and 20 μm in magnified (Ai).

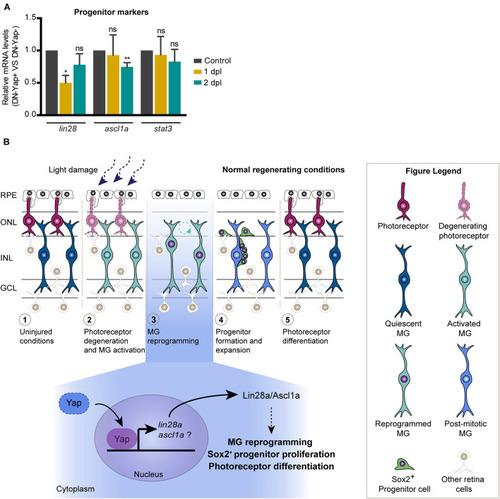
Model for the role of Yap during zebrafish retina regeneration. (A) Relative gene expression of progenitor markers at 1 and 2 dpl (n = 4 biological replicates for 1 dpl; n = 7 biological replicates for 2 dpl) in DN-Yap+ versus DN-Yap− controls. ns, non-significant; *p < 0.05, **p < 0.01. Paired t-test for the relative gene expression of progenitor markers. (B) In the zebrafish model system, in response to a light-induced lesion, photoreceptors start to degenerate, and quiescent Müller glial cells (MGs) become activated in response to the insult. Activated MGs then undergo a reprogramming event, reentering the cell cycle, and dividing and producing a pool of progenitor cells that migrate to the lesion site and differentiate into new photoreceptors. Based on our findings, we propose a model for the role of Yap during MG reprogramming after photoreceptor damage. Our data suggest that Yap is required to regulate MG reprogramming possibly via a lin28aascl1a-dependent mechanism, being necessary for correct Sox2 + progenitor proliferation and photoreceptor differentiation. We suggest that Yap regulates lin28a expression; however, if ascl1a is also regulated by Yap or Lin28a, it still needs further investigation.

Acknowledgments
This image is the copyrighted work of the attributed author or publisher, and ZFIN has permission only to display this image to its users. Additional permissions should be obtained from the applicable author or publisher of the image. Full text @ Front Cell Dev Biol