FIGURE SUMMARY
Title

Collective behavior emerges from genetically controlled simple behavioral motifs in zebrafish

Authors
Harpaz, R., Aspiras, A.C., Chambule, S., Tseng, S., Bind, M.A., Engert, F., Fishman, M.C., Bahl, A.
Source
Full text @ Sci Adv

Aggregation in developing zebrafish.

(A) Left: Groups of five fish were tested in circular arenas, while overhead cameras recorded their behaviors. Right: Position and body orientations of each fish were extracted from the movies. (B) Example traces of the aggregation index (left) and alignment index (right) (see Methods) of groups of 7- and 21-dpf wild-type fish. Dotted lines represent baseline dispersion and aggregation levels of shuffled control groups. At 21 dpf, fish show higher aggregation and alignment than 7-dpf fish. (C) Left: At 7 dpf, fish are less aggregated than shuffled control groups (PBootstrap ≈ 0.047, N = 18 groups; Cohen’s d = −0.49) (see Methods), while 21-dpf fish form tight groups (PBootstrap < 1/100,000; N = 25 groups, Cohen’s d = 2.5). Right: 7-dpf fish are more aligned than shuffled control groups (PBootstrap ≈ 0.0002, Cohen’s d = 0.8), and 21-dpf fish are more aligned than 7-dpf fish (PFisher < 1/100,000; Cohen’s d = 1.8). *P < 0.05, ***P < 0.0005. (D) Pearson’s correlation of alignment and aggregation in 7-dpf (left) and 21-dpf (right) fish. Uncertainty regions are based on pointwise 95% CIs of the linear regression model (Methods). (E) Effect of “visual clutter.” Left: We reconstruct the visual angle that each neighboring fish is expected to cast on the retina of a focal fish (see Methods). Middle: The difference between total angular area (or visual clutter) experienced by each eye modulates the probability to turn away (7 dpf) or toward (21 dpf) the more cluttered visual field. Bold lines represent turning probability calculated from left/right turning events recorded from all fish in 5° bins. Uncertainty regions are based on pointwise 95% CI of a fitted binomial distribution to the events in each bin. Right: The integral of the curves in the middle panels symmetrized such that repulsion from clutter is negative and attraction is positive.

Single-gene mutations affect aggregation and alignment of developing zebrafish.

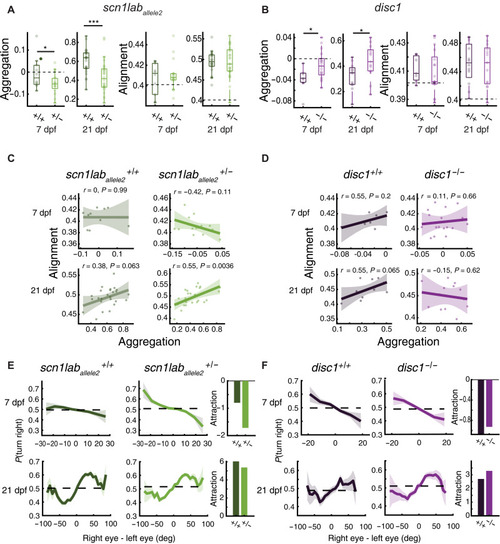
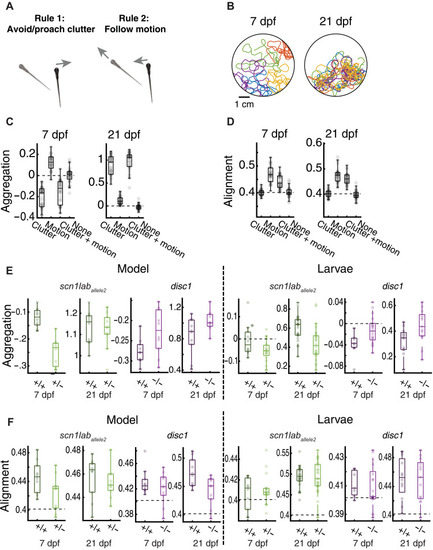
+/+, +/− , and –/– refer to sibling-controlled wild-type and mutant fish. (A) Left: At 7 dpf, scn1lab+/− fish are more dispersed than wild-type siblings (PFisher ≈ 0.036, N+/+ = 10, N+/− = 16 groups, Cohen’s d = −0.8). Dashed lines represent values of shuffled groups. At 21 dpf, fish are more aggregated. Scn1lab+/− aggregate less than scn1lab+/+ (PFisher ≈ 0.0001; N+/+ = 25, N+/− = 26 groups, Cohen’s d = −1.09). Right: Group alignment increases with age; however, we could not detect an effect of the scn1lab mutation (P7 Fisher = 0.26, P21 Fisher = 0.47). *P < 0.05, ***P < 0.0005. (B) Left: At 7 dpf, disc1−/− are less dispersed than wild-type siblings (PFisher ≈ 0.0128; N+/+ = 7, N−/− = 17 groups, Cohen’s d = 1.04). At 21 dpf, disc1−/− show more aggregation compared to wild-type siblings (PFisher ≈ 0.0129; N+/+ = 12, N−/− = 13 groups, Cohen’s d = 0.95). Right: We could not detect effect of the disc1 mutation on alignment (P7 Fisher = 0.33, P21 Fisher = 0.40). (C) Pearson’s correlation of alignment and aggregation in scn1laballele2 7-dpf (top) and 21-dpf (bottom) fish. Positive correlation for 21-dpf scn1laballele2+/− fish. Uncertainty regions are the pointwise 95% CI of the linear regression model. (D) We could not detect correlation for disc1. (E) Left: scn1laballele2+/− turn away more from visual clutter at 7 dpf (top) and turn toward clutter less at 21 dpf (bottom). Right: Integral of the curves symmetrized. Repulsion is negative. Attraction is positive. (F) Same as in (E) but for disc1. Mutants show a flattening of the 7-dpf repulsion curve (top) and an enhancement in 21-dpf attraction (bottom). Bold lines in (E) and (F) represent turning probability calculated from left/right turns of all fish in 5° bins; uncertainty regions are the pointwise 95% CI of a fitted binomial distribution to the events in each bin.

Mutant 7-dpf larval zebrafish display differential integration and alignment phenotypes, which can be quantitatively captured by a simple integrator model.

(A) Experimental setup [adapted from (39)]. A single larval zebrafish swims freely on top of a projected cloud of randomly moving dots. Dots move continuously at different coherence levels either to the right or left relative to the body orientation of the animal (movie S1). (B) Probability to correctly align with the coherent motion stimulus as a function of coherence strength. Scn1laballele2+/− mutant fish (bright green) show improved performance relative to scn1laballele2+/+ wild-type sibling controls (dark green). Our data did not allow us to report a difference in performance of the disc1 mutant (magenta) compared to sibling controls (black). (C) Interbout interval as a function of coherence. Values are elevated for both mutants relative to wild-type sibling controls. (D) Tendency to turn in the same direction as a function of the time since the last bout during randomly flickering 0% coherence stimulation. Responses are elevated for the scn1laballele2 mutant relative to wild-type sibling controls. (E) Integrator model with decision threshold (T), perceptual noise (σ), leak time constant (τ), and probabilities to make a turn or swim forward (pabove and pbelow, depending on whether the integrated value is above or below the threshold). (F to H) Optimized model results, analyzed and displayed as in (B) to (D). The model accurately captures the behavioral features of both wild-type and mutant larvae. N = 44, 36, 21, and 16 individually tested fish for genotypes scn1laballele2+/+, scn1laballele2+/−, disc1+/+, and disc1−/−, respectively, in (B) to (D). N = 12 models (different optimization repeats) for each genotype in (F) to (H). Error bars in (B) to (D) and (F) to (H) are ± SEM.

Simple visuomotor reflexes qualitatively predict emergent group behavior across genotypes and development.

(A) Schematic of the model using only two simple algorithmic rules: First, fish are repelled or attracted to visual clutter (see Fig. 1E). Second, fish use global motion cues for turning decisions (see Fig. 2, A and E). Both cues are integrated over time and evaluated according to our integrator model (Fig. 2E). Model parameters for the clutter response strength are directly extracted from group swimming experiments (Fig. 2, E and F). Model parameters for the integration and decision-making process are taken from our multiobjective parameter fitting results (fig. S4B). The model is hence almost fully constrained by experimental data. (B) Example trajectories of simulated wild type 7 and 21 dpf based on the rules shown in (A). (C and D) Aggregation and alignment for wild-type simulations for all possible rule combinations (neither rule, only motion, only clutter, or both rules) for 7- and 21-dpf model fish. Alignment does not emerge with attraction alone; it additionally requires animals to perform motion integration. Conversely, motion integration induces some level of aggregation. Parameters for wild-type animals are the same as for the sibling controls for all tested mutant lines. (E and F) Aggregation and alignment for 7- and 21-dpf mutant model fish with respective sibling controls (left) and the corresponding data of real fish (right; same data as in Fig. 2). Our model can qualitatively predict all group behavior phenotypes across ages as found in our experimental group assay (Fig. 2, A and B). N = 36 model simulations (each model uses different parameter sets, following our repeated model optimization; fig. S4B) in (C) and (D) and N = 12 model simulations for each genotype in (E) and (F). Experimental data in (E) and (F) are the same as in Fig. 2 (A and B).

Acknowledgments
This image is the copyrighted work of the attributed author or publisher, and ZFIN has permission only to display this image to its users. Additional permissions should be obtained from the applicable author or publisher of the image. Full text @ Sci Adv