|
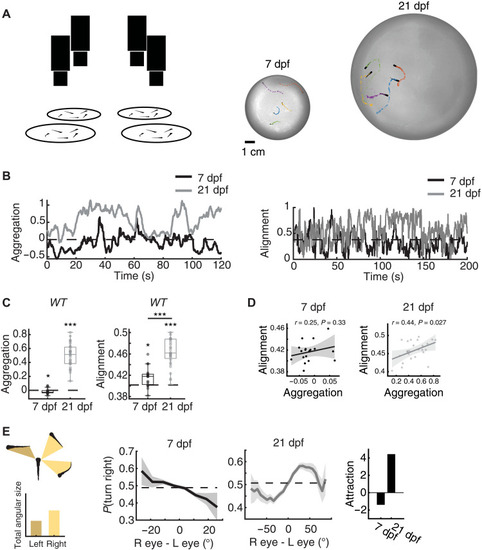
Aggregation in developing zebrafish.(A) Left: Groups of five fish were tested in circular arenas, while overhead cameras recorded their behaviors. Right: Position and body orientations of each fish were extracted from the movies. (B) Example traces of the aggregation index (left) and alignment index (right) (see Methods) of groups of 7- and 21-dpf wild-type fish. Dotted lines represent baseline dispersion and aggregation levels of shuffled control groups. At 21 dpf, fish show higher aggregation and alignment than 7-dpf fish. (C) Left: At 7 dpf, fish are less aggregated than shuffled control groups (PBootstrap ≈ 0.047, N = 18 groups; Cohen’s d = −0.49) (see Methods), while 21-dpf fish form tight groups (PBootstrap < 1/100,000; N = 25 groups, Cohen’s d = 2.5). Right: 7-dpf fish are more aligned than shuffled control groups (PBootstrap ≈ 0.0002, Cohen’s d = 0.8), and 21-dpf fish are more aligned than 7-dpf fish (PFisher < 1/100,000; Cohen’s d = 1.8). *P < 0.05, ***P < 0.0005. (D) Pearson’s correlation of alignment and aggregation in 7-dpf (left) and 21-dpf (right) fish. Uncertainty regions are based on pointwise 95% CIs of the linear regression model (Methods). (E) Effect of “visual clutter.” Left: We reconstruct the visual angle that each neighboring fish is expected to cast on the retina of a focal fish (see Methods). Middle: The difference between total angular area (or visual clutter) experienced by each eye modulates the probability to turn away (7 dpf) or toward (21 dpf) the more cluttered visual field. Bold lines represent turning probability calculated from left/right turning events recorded from all fish in 5° bins. Uncertainty regions are based on pointwise 95% CI of a fitted binomial distribution to the events in each bin. Right: The integral of the curves in the middle panels symmetrized such that repulsion from clutter is negative and attraction is positive.
|