|
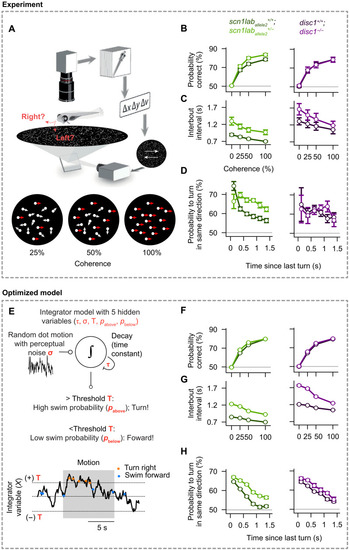
Mutant 7-dpf larval zebrafish display differential integration and alignment phenotypes, which can be quantitatively captured by a simple integrator model.(A) Experimental setup [adapted from (39)]. A single larval zebrafish swims freely on top of a projected cloud of randomly moving dots. Dots move continuously at different coherence levels either to the right or left relative to the body orientation of the animal (movie S1). (B) Probability to correctly align with the coherent motion stimulus as a function of coherence strength. Scn1laballele2+/− mutant fish (bright green) show improved performance relative to scn1laballele2+/+ wild-type sibling controls (dark green). Our data did not allow us to report a difference in performance of the disc1 mutant (magenta) compared to sibling controls (black). (C) Interbout interval as a function of coherence. Values are elevated for both mutants relative to wild-type sibling controls. (D) Tendency to turn in the same direction as a function of the time since the last bout during randomly flickering 0% coherence stimulation. Responses are elevated for the scn1laballele2 mutant relative to wild-type sibling controls. (E) Integrator model with decision threshold (T), perceptual noise (σ), leak time constant (τ), and probabilities to make a turn or swim forward (pabove and pbelow, depending on whether the integrated value is above or below the threshold). (F to H) Optimized model results, analyzed and displayed as in (B) to (D). The model accurately captures the behavioral features of both wild-type and mutant larvae. N = 44, 36, 21, and 16 individually tested fish for genotypes scn1laballele2+/+, scn1laballele2+/−, disc1+/+, and disc1−/−, respectively, in (B) to (D). N = 12 models (different optimization repeats) for each genotype in (F) to (H). Error bars in (B) to (D) and (F) to (H) are ± SEM.
|