
- Title
-
Homozygous WASHC4 variant in two sisters causes a syndromic phenotype defined by dysmorphisms, intellectual disability, profound developmental disorder, and skeletal muscle involvement
- Authors
- Gangfuß, A., Czech, A., Hentschel, A., Münchberg, U., Horvath, R., Töpf, A., O'Heir, E., Lochmüller, H., Stehling, F., Kiewert, C., Sickmann, A., Kuechler, A., Kaiser, F., Kölbel, H., Christiansen, J., Schara-Schmidt, U., Roos, A.
- Source
- Full text @ J. Pathol.
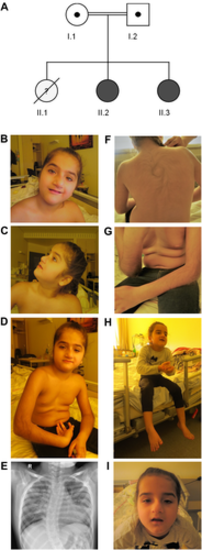
Clinical findings. (A) Family pedigree: I.1 and I.2: healthy, consanguineous parents (cousins I°) of Middle Eastern descent (United Arab Emirates). II.1: first female child, born at 29 weeks of gestation, died 4 days after birth due to unknown cause. II.2: sibling 1, WASHC4 patient 11. II.3: sibling 2, WASHC4 patient 12. (B–I) Clinical phenotype. Sibling 1: (B) Facial dysmorphic features: enlarged and coarsened nasal tip with deviation to the left side, small upper lip vermilion, small eyes with moderate ptosis and mild strabismus, high arched eyebrows, and discreet synophrys. (C) Low-set ears with enlarged ear lobes, and prominent forehead with low-set hairline. (D) Generalized muscle hypotonia. (E) X-ray of thorax in supine position showing bipulmonary infiltrations and right convex scoliosis. (F, G) General hirsutism, predominantly on the back and forearms. Sibling 2: (H, I) Stereotype movements of the hands and facial dysmorphic features: enlarged and coarsened nasal tip with deviation to the right side; small eyes with moderate ptosis and low-set ears. Informed consent to publish photographs was obtained for both patients.
|
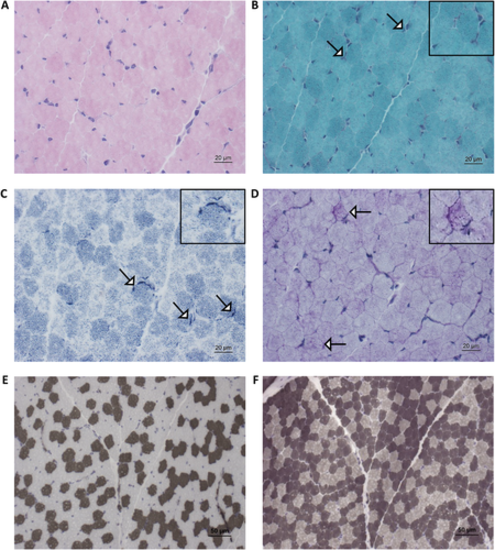
Muscle biopsy finding based on histological examination: (A) Hematoxylin and eosin (H&E) stain: musculature seen transversely and obliquely, preserved fascicle structure; perimysial connective tissue proliferation, no fat cell proliferation; no lymphohistiocytic cell infiltrates; muscle fibers polygonal, physiological fiber size variability, no fiber fragmentation or nuclear clumps; predominantly peripheral nuclei (centrally located nuclei <3%). No cell necrosis or basophil regenerating fibers; no ragged red fibers; no intracellular glycogen or lipid proliferation. (B) Modified Gomori stain shows occasionally the enrichment of mitochondria subsarcolemmally (white arrows). (C) Nicotinamide adenine dinucleotide hydrogen (NADH) stain shows increased subsarcolemmal reactivity in a minority of fibers (white arrows). (D) Periodic acid–Schiff (PAS) stain shows increased sarcoplasmic build-up on a minority of diseased muscle fibers (white arrows). (E, F) Adenosine triphosphatase (ATPase) stain (at pH 4.3 and 9.4) shows fiber-type disproportion (increased abundance of type 2 fibers). Insets show areas of interest in greater detail.
|
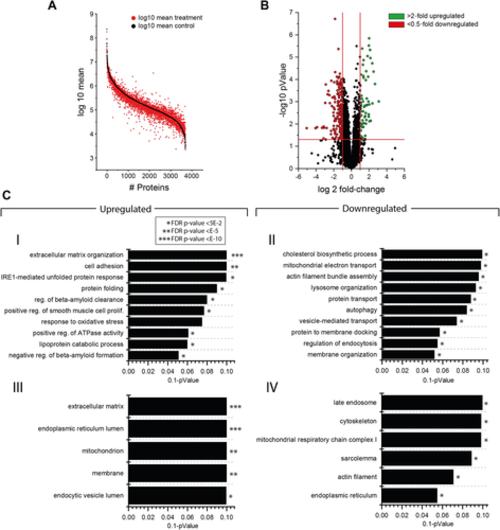
Proteomic profiling of WASHC4 patient-derived fibroblasts. (A) Protein enrichment plot along the entire abundance range. Proteins highlighted in black represent the results of control samples, sorted by abundance. Proteins highlighted in red represent the abundance of WASHC4 patient-derived fibroblasts, left in the same order as the proteins of the control samples to highlight differences in their expression. (B) Volcano plot of proteomic data depicting the log2 fold-change of identified proteins against the –log10 pValue. Red dots represent proteins showing a significant decrease, whereas green dots represent proteins with a significant increase in abundance by comparing control against WASHC4 patient-derived fibroblasts. (C) GO term analysis depicting different biological processes and cellular compartments significantly regulated by comparing control samples against WASHC4 patient-derived fibroblasts. Upregulated (I) and downregulated (II) biological processes, sorted by level of significance and enrichment, respectively. III and IV depict upregulated and downregulated cellular compartments, respectively.
|
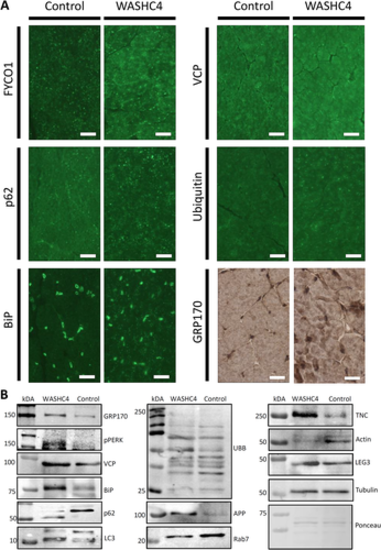
Immunological studies on WASHC4 patient-derived quadriceps muscle. (A) Immunostaining of FYCO1, p62, VCP, ubiquitin, BiP, and GRP170 reveals increased sarcoplasmic immunoreactivity in WASHC4-mutant muscle fibers. Scale bars = 30 μm. (B) Immunoblotting results confirming the increase of FYCO1, p62, VCP, ubiquitin, BiP, and GRP170 in whole protein extracts of the WASHC4 patient-derived muscle. LC3 showed an increased conversion from LC3-I to LC3-II in the WASHC4 patient-derived muscle. p62 showed a band at a lower molecular weight compared with the control. Additionally, there were increases of galectin-3 (LEG3), phospho-PERK (pPERK), and amyloid, as well as decreases of Rab7, actin, and tenascin (TNC). Ponceau staining of a representative nitrocellulose membrane demonstrates equal protein loading.
|
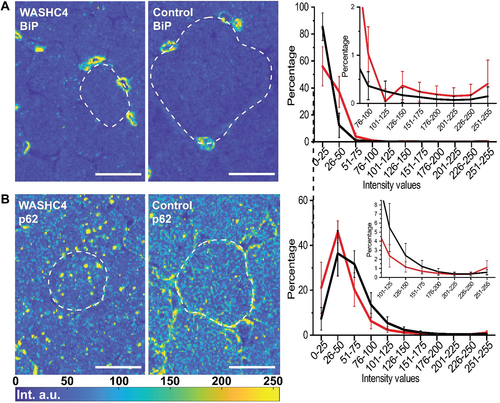
Single muscle fiber histogram analysis: (A) BiP and (B) p62. Representative rescaled fluorescence images (see Materials and methods) of muscle from the patient (left) and a healthy individual (center). Representative fibers are framed with dashed lines for better visualization. Right: intensity histogram of the processed fluorescence images. The mean value and standard deviation from 25 single cells per sample are shown for the patient (red) and the control (black) sample. Scale bars: 25 μm.
|
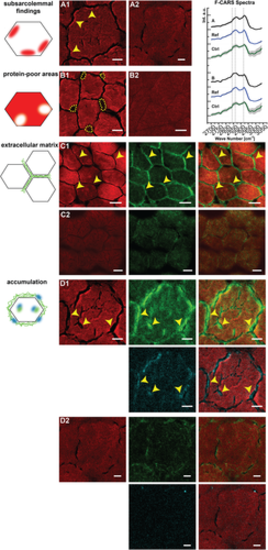
Spectroscopic findings in the muscle biopsies of the WASHC4 patient determined from CARS and SHG. (A1) Subsarcolemmal regions of patient fiber with increased CARS signal in the forward direction (F-CARS) at 2921 cm−1 (marked with arrowheads; scale bar: 6 μm). (A2) Fiber of a control without subsarcommal regions with increased CARS signal (scale bar: 5 μm). (B1) Subsarcolemmal areas of patient fibers with low F-CARS signal intensity at 2921 cm−1. The roundish areas are surrounded by dotted lines (scale bar: 8 μm). (B2) Fibers of a control without roundish areas with low F-CARS signal at 2931 cm−1 (scale bar: 20 μm). For A1 and B1, respectively, a spectrum derived from the areas with altered F-CARS signal is shown on the far right. A corresponding reference spectrum (Ref) was derived from an area of the patient's muscle fiber that showed no abnormalities. In addition, a spectrum of the controls (Ctrl) is shown. Spectra were normalized and then averaged. The standard deviation is shown in grey. The vertical dotted lines highlight the wavenumbers 2847, 2868, and 2921 cm−1. (C1, C2) F-CARS (red), SHG (green), and both merged channels. (C1) Strong SHG signals are observed between the muscle fibers of the patient (marked with arrowheads; scale bars: 15 μm). (C2) Control without strong SHG signal between fibers (scale bars: 15 μm). (D1, D2) F-CARS (red), SHG (green), CARS image detected in the backward direction (E-CARS, cyan), and combinations of merged channels. (D1) Strong signals are present in the ECM as well as in the muscle fibers of the patient. The signals of SHG and E-CARS are partially co-localized (indicated by arrowheads; scale bars: 5 μm). (D2) Corresponding images of the three channels of a control for comparison with D1 (scale bars: 5 μm). The displayed images are averages from three acquisitions and were taken at 811 nm corresponding to 2932 cm−1 for CARS measurements, representing protein distribution.
|