
Image
|
Figure Caption
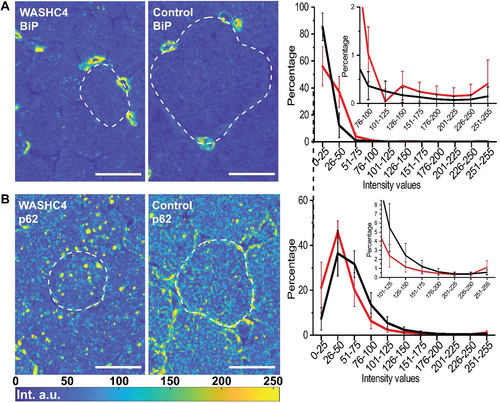
Fig. 5
Single muscle fiber histogram analysis: (A) BiP and (B) p62. Representative rescaled fluorescence images (see Materials and methods) of muscle from the patient (left) and a healthy individual (center). Representative fibers are framed with dashed lines for better visualization. Right: intensity histogram of the processed fluorescence images. The mean value and standard deviation from 25 single cells per sample are shown for the patient (red) and the control (black) sample. Scale bars: 25 μm.
Acknowledgments
This image is the copyrighted work of the attributed author or publisher, and
ZFIN has permission only to display this image to its users.
Additional permissions should be obtained from the applicable author or publisher of the image.
Full text @ J. Pathol.