
Image
|
Figure Caption
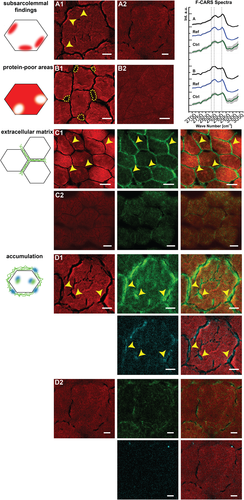
Fig. 6
Spectroscopic findings in the muscle biopsies of the WASHC4 patient determined from CARS and SHG. (A1) Subsarcolemmal regions of patient fiber with increased CARS signal in the forward direction (F-CARS) at 2921 cm−1 (marked with arrowheads; scale bar: 6 μm). (A2) Fiber of a control without subsarcommal regions with increased CARS signal (scale bar: 5 μm). (B1) Subsarcolemmal areas of patient fibers with low F-CARS signal intensity at 2921 cm−1. The roundish areas are surrounded by dotted lines (scale bar: 8 μm). (B2) Fibers of a control without roundish areas with low F-CARS signal at 2931 cm−1 (scale bar: 20 μm). For A1 and B1, respectively, a spectrum derived from the areas with altered F-CARS signal is shown on the far right. A corresponding reference spectrum (Ref) was derived from an area of the patient's muscle fiber that showed no abnormalities. In addition, a spectrum of the controls (Ctrl) is shown. Spectra were normalized and then averaged. The standard deviation is shown in grey. The vertical dotted lines highlight the wavenumbers 2847, 2868, and 2921 cm−1. (C1, C2) F-CARS (red), SHG (green), and both merged channels. (C1) Strong SHG signals are observed between the muscle fibers of the patient (marked with arrowheads; scale bars: 15 μm). (C2) Control without strong SHG signal between fibers (scale bars: 15 μm). (D1, D2) F-CARS (red), SHG (green), CARS image detected in the backward direction (E-CARS, cyan), and combinations of merged channels. (D1) Strong signals are present in the ECM as well as in the muscle fibers of the patient. The signals of SHG and E-CARS are partially co-localized (indicated by arrowheads; scale bars: 5 μm). (D2) Corresponding images of the three channels of a control for comparison with D1 (scale bars: 5 μm). The displayed images are averages from three acquisitions and were taken at 811 nm corresponding to 2932 cm−1 for CARS measurements, representing protein distribution.
Acknowledgments
This image is the copyrighted work of the attributed author or publisher, and
ZFIN has permission only to display this image to its users.
Additional permissions should be obtained from the applicable author or publisher of the image.
Full text @ J. Pathol.