
- Title
-
Exacerbation of Liver Tumor Metastasis in twist1a+/xmrk+ Double Transgenic Zebrafish following Lipopolysaccharide or Dextran Sulphate Sodium Exposure
- Authors
- Lu, J.W., Sun, Y., Lin, L.I., Liu, D., Gong, Z.
- Source
- Full text @ Pharmaceuticals (Basel)
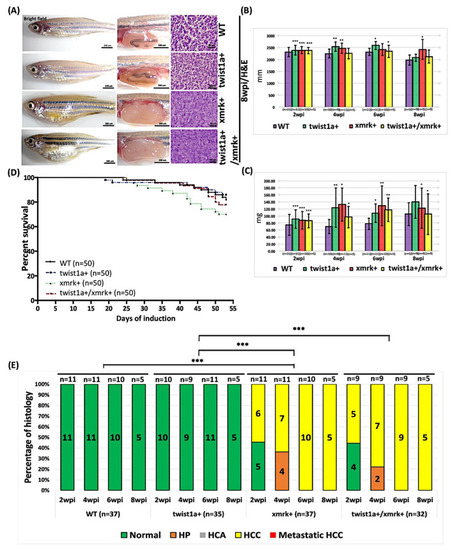
Figure 1. Induction of tumor metastasis in twist1a+/xmrk+ transgenic zebrafish via treatment with Dox in low concentrations. Twist1a+, xmrk+, and twist1a+/xmrk+ transgenic zebrafish as well as wild-type controls were treated with 30 μg/mL Dox and 0.5 μg/mL 4-OHT starting from 3 mpf. Samples were collected at 2, 4, 6, and 8 wpi. (A) Representative images of transgenic zebrafish at 8 wpi. The left column displays the external appearance, the middle column shows internal abdominal organs with the livers outlined, and the right column depicts H&E staining of liver sections. Scale bar: 50 or 200 μm. Compared with the wild-type group, the body size, (B) body length, and (C) weight of most transgenic zebrafish differed significantly at 2, 4, 6, and 8 wpi. (D) Kaplan–Meier survival curves of days post-induction plotted against percent survival until 8 wpi. (E) Histological examination confirmed that xmrk+ and twist1a+/xmrk+ transgenic zebrafish developed HCC at 2, 4, 6, and 8 wpi, whereas normal liver histology was observed in all twist1a+ and wild-type siblings. Differences among variables were assessed using Student’s t-tests or one-way ANOVA. Statistical significance: * p < 0.05, ** p < 0.01, *** p < 0.001.
|
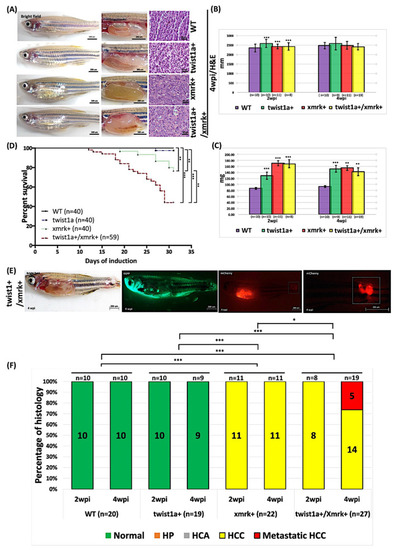
Figure 2. Induction of tumor metastasis in twist1a+/xmrk+ transgenic zebrafish via treatment with Dox in high concentrations. Twist1a+, xmrk+, and twist1a+/xmrk+ transgenic zebrafish as well as wild-type control were treated with 60 μg/mL Dox and 1 μg/mL 4-OHT starting from 3 mpf. Samples were collected at 2 and 4 wpi. (A) Representative images of transgenic zebrafish at 4 wpi. The left column displays external appearance, the middle column shows internal abdominal organs with the livers outlined, and the right column depicts H&E staining of liver sections. Scale bar: 50 or 200 μm. Compared with the wild-type group, (B) the body lengths of transgenic zebrafish differed significantly at 2 wpi but not at 4 wpi, whereas (C) the body weights of transgenic zebrafish differed significantly at 2 and 4 wpi. (D) Kaplan–Meier survival curves of days post-induction plotted against percent survival to 4 wpi. (E) Immunofluorescence analysis of liver tumor metastasis in twist1a+/xmrk+ transgenic zebrafish at 4 wpi. (F) Histological examination confirmed that xmrk+ and twist1a+/xmrk+ transgenic zebrafish developed HCC or metastatic HCC at 2 and 4 wpi, whereas normal liver histology was observed in all twist1a+ and wild-type siblings. Differences among variables were assessed using Student’s t-tests or one-way ANOVA. Statistical significance: * p < 0.05, ** p < 0.01, *** p < 0.001.
|
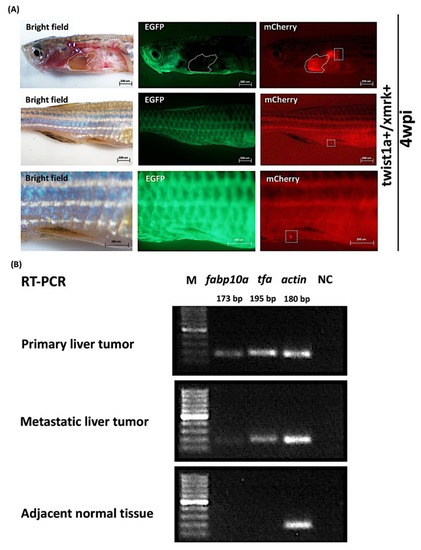
Figure 3. Expression of liver markers fabp10a and tfa in primary and metastatic liver tumor tissues from twist1a+/xmrk+ double transgenic zebrafish. Twist1a+/xmrk+ transgenic zebrafish were treated with 60 μg/mL Dox and 1 μg/mL 4-OHT. (A) mCherry immunofluorescence analysis of twist1a+/xmrk+ liver tumor metastasis at 4 wpi. Scale bar: 200 μm. (B) Results of semiquantitative RT-PCR showing the expression of fabp10a and tfa in primary tumor, metastatic liver tumor, and adjacent normal tissues. Actin and non-template, respectively, served as an internal control and negative control.
EXPRESSION / LABELING:
|
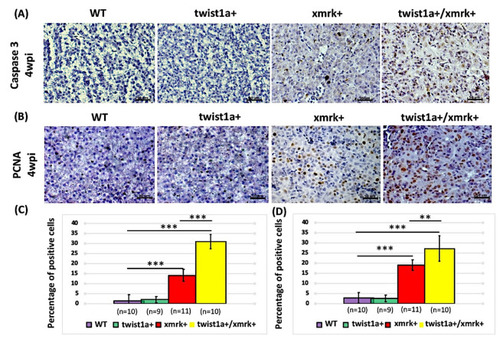
Figure 4. Assessment of apoptosis and cell proliferation in instances of HCC progression in twist1a+/xmrk+ double transgenic zebrafish. Immunohistochemical staining was performed on liver paraffin sections from wild-type, twist1a+, xmrk+, and twist1a+/xmrk+ zebrafish. (A) Caspase-3 staining for apoptosis; and (B) PCNA staining for proliferation at 4 wpi. Scale bar: 50 μm. Quantification of the percentage of cells testing positive for (C) caspase-3 and (D) PCNA. Differences among the variables were assessed using Student’s t-tests. Statistical significance: ** p < 0.01, *** p < 0.001.
|

Figure 5. Assessment of E-cadherin and vimentin staining in instances of HCC progression in twist1a+/xmrk+ double transgenic zebrafish. Immunohistochemical staining was performed on liver paraffin sections from WT, twist1a+, xmrk+, and twist1a+/xmrk+ zebrafish at 4 wpi. Staining of markers of EMT activation: (A) E-cadherin and (B) vimentin. Scale bar: 50 μm. Quantification of the percentage of cells testing positive for (C) E-cadherin and (D) vimentin. Differences among the variables were assessed using Student’s t-tests. Statistical significance: ** p < 0.01, *** p < 0.001.
|
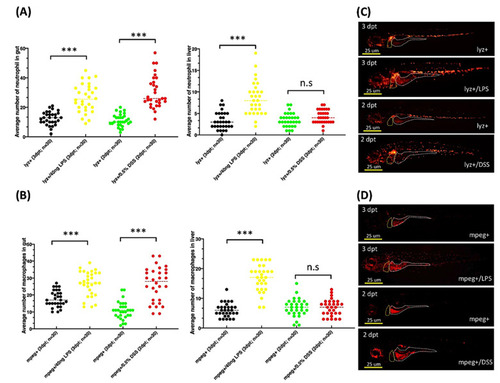
Figure 6. Increases in the numbers of neutrophils and macrophage in the gut and liver of lyz+/LPS, lyz+/DSS, mpeg1+/LPS, and mpeg1+/DSS zebrafish larvae exposed to LPS or DSS. Quantification (via fluorescence) of the number of cells in the gut and liver of zebrafish larvae testing positive for (A) neutrophils (lyz+) or (B) macrophages (mpeg1+) accompanied by representative fluorescence images of (C) neutrophils and (D) macrophages. Differences among the variables were assessed using Student’s t-tests. Statistical significance: *** p < 0.001. Scale bar: 25 μm.
PHENOTYPE:
|

Figure 7. Exposure to LPS or DSS exacerbated the increase in liver size and HCC progression in xmrk+ zebrafish. (A) Quantification and (B) representative images of liver size in xmrk+, xmrk+/LPS, and xmrk+/DSS zebrafish larvae as well as xmrk- siblings at 3 dpt. (C) xmrk+, xmrk+/LPS, and xmrk+/DSS transgenic zebrafish as well as xmrk- control transgenic zebrafish were treated at 4 mpf with 20 μg/mL Dox plus 40 ng/mL LPS or 0.5% DSS, with samples taken at 2 wpi. The left column shows internal abdominal organs with the livers outlined, and the right column depicts H&E staining of liver sections. Scale bar: 50 or 200 μm. (D) Kaplan–Meier survival curves showing days post-induction plotted against percentage survival to 2 wpi. (E) Histological examination confirmed that xmrk+, xmrk+/LPS, and xmrk+/DSS transgenic zebrafish developed HCC at 2 wpi, compared to normal liver histology in xmrk- siblings. Differences among the variables were assessed using Student’s t-tests or one-way ANOVA. Statistical significance: * p < 0.05, ** p < 0.01, *** p < 0.001.
PHENOTYPE:
|
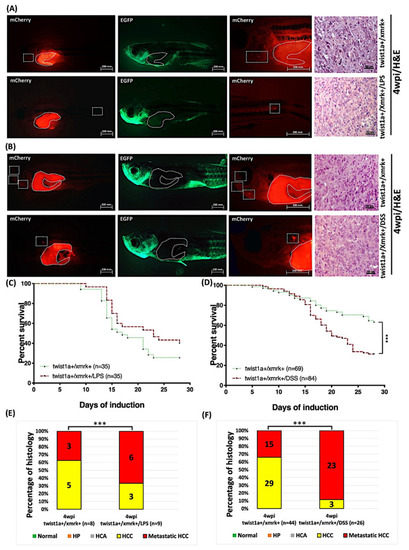
Figure 8. Induction of tumor metastasis in twist1a+/xmrk+ transgenic zebrafish via Dox and 4-OHT treatment under exposure to LPS or DSS. Twist1a+/xmrk+ transgenic zebrafish were treated with 60 μg/mL Dox and 1 μg/mL 4-OHT starting from 4 mpf with sampling performed at 4 wpi. (A,B) Immunofluorescence analysis of twist1a+/xmrk+ liver tumor metastasis at 4 wpi with corresponding H&E histological examination of liver sections. Scale bar: 50 or 200 μm. (C,D) Kaplan–Meier survival curves showing days post-induction plotted against percentage survival to 4 wpi. (E,F) Histological examination confirmed that at 4 wpi, all twist1a+/xmrk+ transgenic zebrafish developed HCC or metastatic HCC. Differences among the variables were assessed using one-way ANOVA. Statistical significance: *** p < 0.001.
PHENOTYPE:
|