
Image
|
Figure Caption
Figure 1
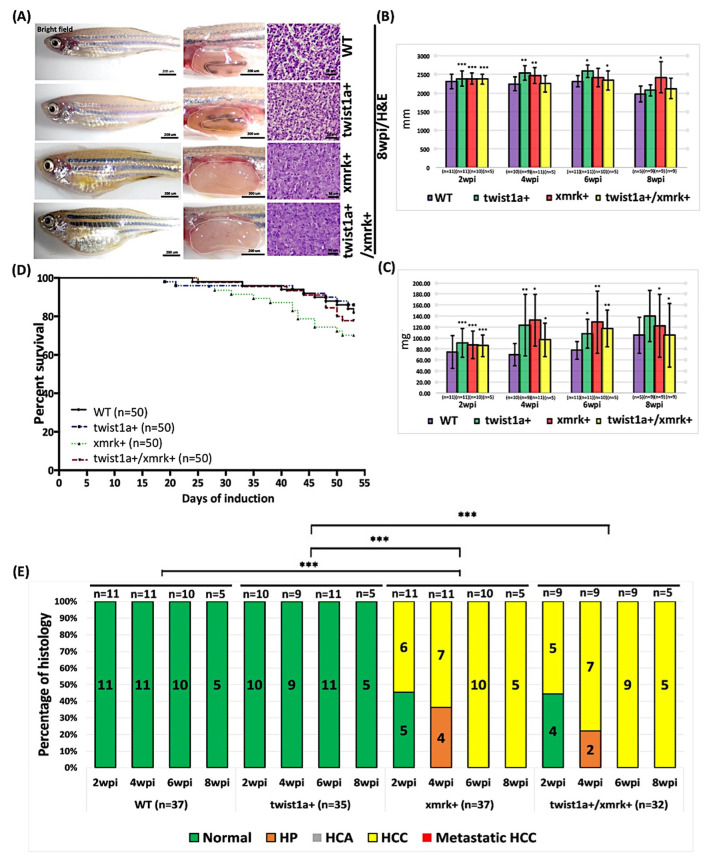
Figure 1. Induction of tumor metastasis in twist1a+/xmrk+ transgenic zebrafish via treatment with Dox in low concentrations. Twist1a+, xmrk+, and twist1a+/xmrk+ transgenic zebrafish as well as wild-type controls were treated with 30 μg/mL Dox and 0.5 μg/mL 4-OHT starting from 3 mpf. Samples were collected at 2, 4, 6, and 8 wpi. (A) Representative images of transgenic zebrafish at 8 wpi. The left column displays the external appearance, the middle column shows internal abdominal organs with the livers outlined, and the right column depicts H&E staining of liver sections. Scale bar: 50 or 200 μm. Compared with the wild-type group, the body size, (B) body length, and (C) weight of most transgenic zebrafish differed significantly at 2, 4, 6, and 8 wpi. (D) Kaplan–Meier survival curves of days post-induction plotted against percent survival until 8 wpi. (E) Histological examination confirmed that xmrk+ and twist1a+/xmrk+ transgenic zebrafish developed HCC at 2, 4, 6, and 8 wpi, whereas normal liver histology was observed in all twist1a+ and wild-type siblings. Differences among variables were assessed using Student’s t-tests or one-way ANOVA. Statistical significance: * p < 0.05, ** p < 0.01, *** p < 0.001.
Figure Data
Acknowledgments
This image is the copyrighted work of the attributed author or publisher, and
ZFIN has permission only to display this image to its users.
Additional permissions should be obtained from the applicable author or publisher of the image.
Full text @ Pharmaceuticals (Basel)