FIGURE SUMMARY
Title

NS398 as a potential drug for autosomal-dominant polycystic kidney disease: Analysis using bioinformatics, and zebrafish and mouse models

Authors
Chen, S., Huang, L., Zhou, S., Zhang, Q., Ruan, M., Fu, L., Yang, B., Xu, D., Mei, C., Mao, Z.
Source
Full text @ J. Cell. Mol. Med.

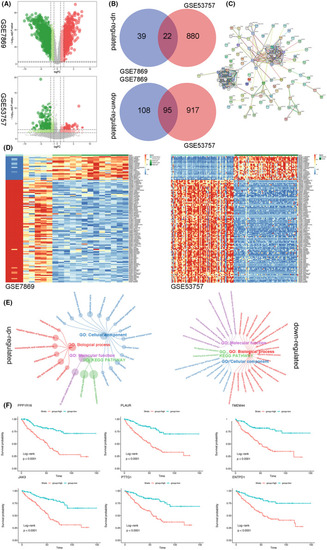
Differentially expressed genes (DEGs) identified in the GSE7869 and GSE53757 datasets. (A) Volcano maps of DEGs in GSE7869 and GSE53757. (B) Venn diagrams displaying the commonly up‐regulated and down‐regulated DEGs. (C) Protein–protein interaction network of common DEGs. (D) Heatmap of up‐regulated and down‐regulated DEGs. The coloured bars on the top (shades of green) indicate the sample types. (E) GO and KEGG pathway enrichment analysis of common DEGs. (F) Kaplan‐Meier survival analysis of the top 6 unique DEGs in ccRCC ranked by hazard ratio based on the TCGA Kidney (Renal Cell) Cancer data (the red line represents high‐expression group, whereas the blue line represents low‐expression group)
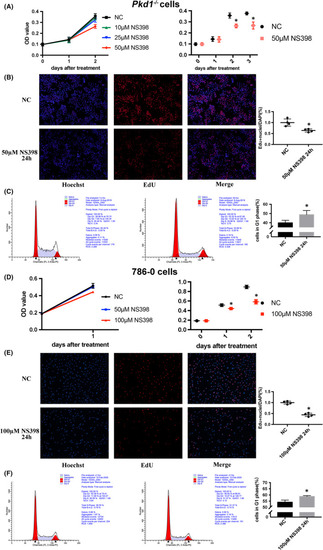
NS398 inhibits Pkd1−/− and 786‐0 cell proliferation in vitro. (A) MTT assay of Pkd1−/− cells after administration of NS398 at different doses. (B) EdU proliferation assay analysis of the growth of Pkd1−/− cells after treatment with 50 μM NS398 for 24 h. The cells in blue (stained with Hoechst) represent all living cells, whereas the red fluorescent cells are in the S phase of mitosis. (C) Effects of 50 μM NS398 on cell cycle distribution of Pkd1−/− cells. (D) MTT assay of 786‐0 cells after administration of NS398 at different doses. (E) and (F) EdU proliferation assay and cell cycle analyses of the effects of 100 μM NS398 on the growth of 786‐0 cells after treatment for 24 h (* p < 0.05, t test)

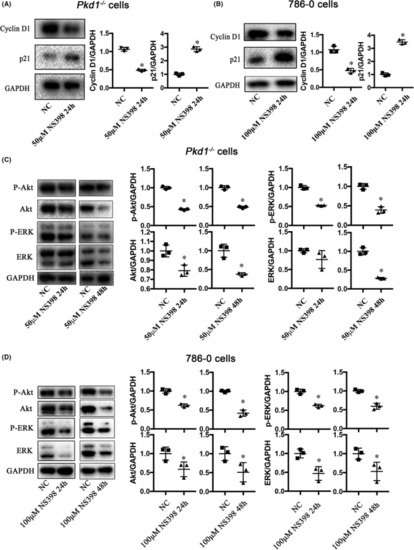
NS398 down‐regulates the abundance of cell cycle and proliferation‐related signalling proteins. (A) and (B) Western blot showing the effects of NS398 on the levels of cyclin D1 and p21 in
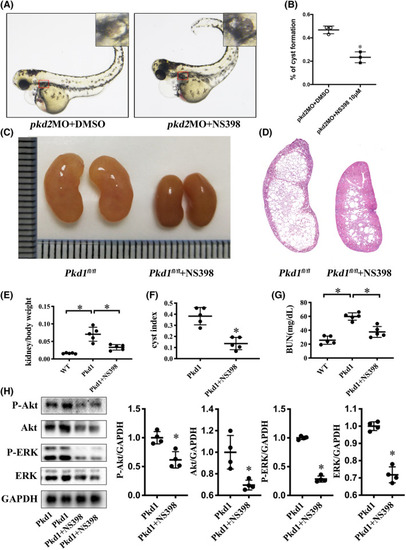
 Pkd1−/− (50 μM) and 786‐0 cells (100 μM), respectively. (C) and (D)Western blot showing the effects of NS398 on the levels of phospho‐ and total Akt and ERK in Pkd1−/− (50 μM) and 786‐0 (100 μM) cells for 24 and 48 h, respectively. GAPDH was used as the loading control (*p < 0.05, t test)

NS398 reduces cyst formation in vivo. (A) Representative images of Pkd2 morphants treated with vehicle (DMSO) or NS398. (B) Quantification showing the average percentage of embryos with kidney cysts in the two groups from three independent experiments. Fifty embryos per group were examined in each experiment. (C) and (D) Representative immunohistochemical images of kidneys and scans of whole kidneys isolated from Pkd1‐knockout mice treated with the vehicle (DMSO) or 20 μg/g NS398, stained with HE. (E), (F), and (G) Quantitative analysis of kidney/body weight ratio, CI, and BUN levels of wild‐type, diseased and NS398‐treated mice (n = 5 per group; p < 0.05.) (H) Western blot showing the effects of NS398 on the levels of phospho‐ and total Akt and ERK in diseased and NS398‐treated mice (*p < 0.05, t test)

PHENOTYPE:
Fish:
Condition:
Knockdown Reagent:
Observed In:
Stage: Protruding-mouth
Acknowledgments
This image is the copyrighted work of the attributed author or publisher, and ZFIN has permission only to display this image to its users. Additional permissions should be obtained from the applicable author or publisher of the image. Full text @ J. Cell. Mol. Med.