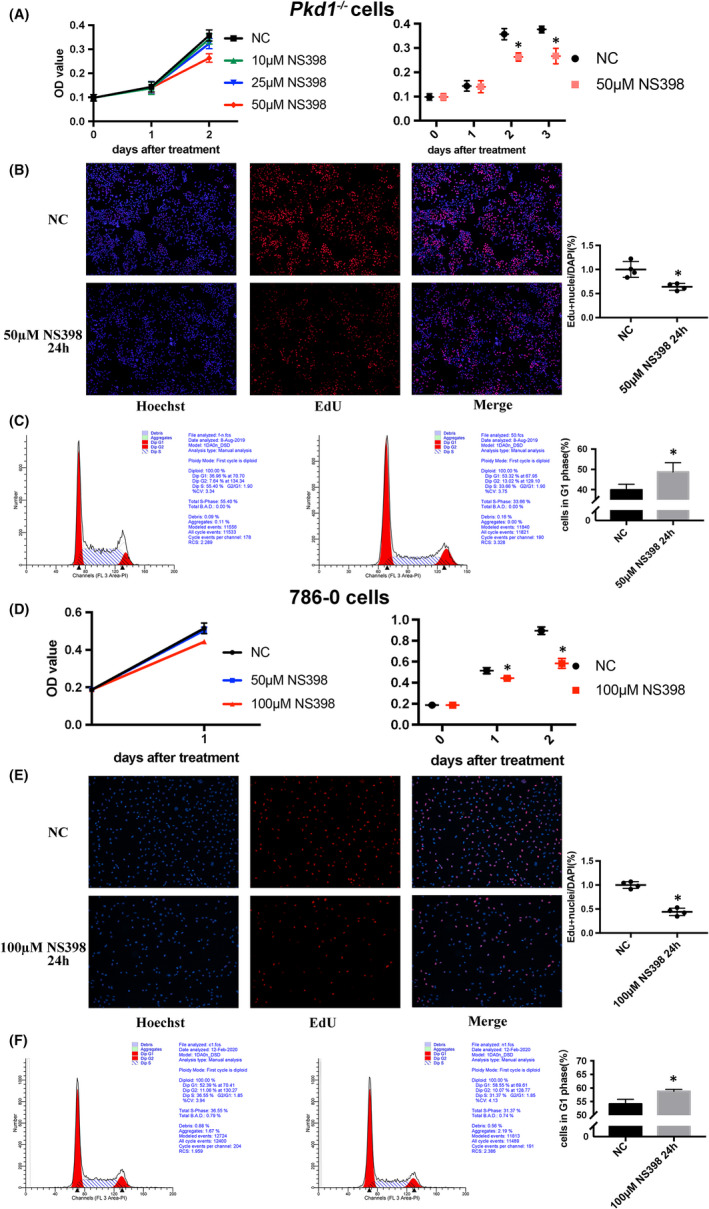
IMAGE

FIGURE 2

ID
ZDB-IMAGE-211025-84
Source
Figures for Chen et al., 2021
Image
Figure Caption

FIGURE 2

NS398 inhibits Pkd1−/− and 786‐0 cell proliferation in vitro. (A) MTT assay of Pkd1−/− cells after administration of NS398 at different doses. (B) EdU proliferation assay analysis of the growth of Pkd1−/− cells after treatment with 50 μM NS398 for 24 h. The cells in blue (stained with Hoechst) represent all living cells, whereas the red fluorescent cells are in the S phase of mitosis. (C) Effects of 50 μM NS398 on cell cycle distribution of Pkd1−/− cells. (D) MTT assay of 786‐0 cells after administration of NS398 at different doses. (E) and (F) EdU proliferation assay and cell cycle analyses of the effects of 100 μM NS398 on the growth of 786‐0 cells after treatment for 24 h (* p < 0.05, t test)

Acknowledgments
This image is the copyrighted work of the attributed author or publisher, and ZFIN has permission only to display this image to its users. Additional permissions should be obtained from the applicable author or publisher of the image. Full text @ J. Cell. Mol. Med.