FIGURE SUMMARY
Title

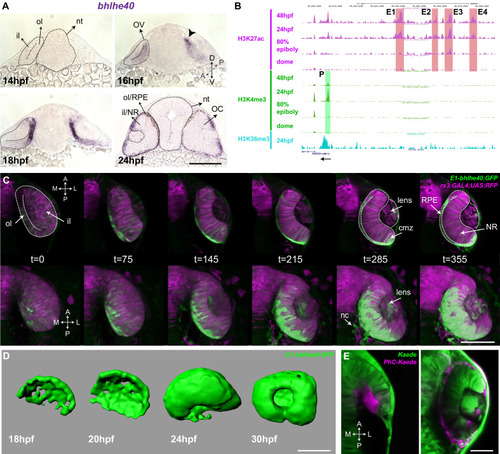
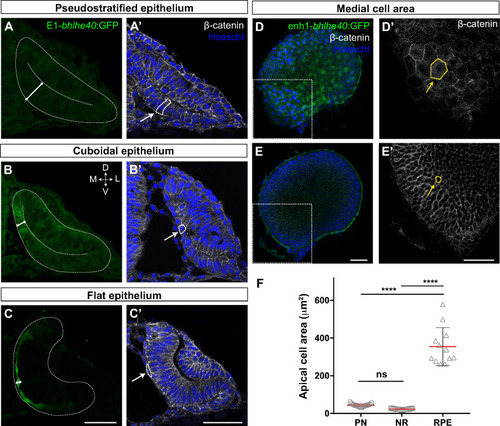
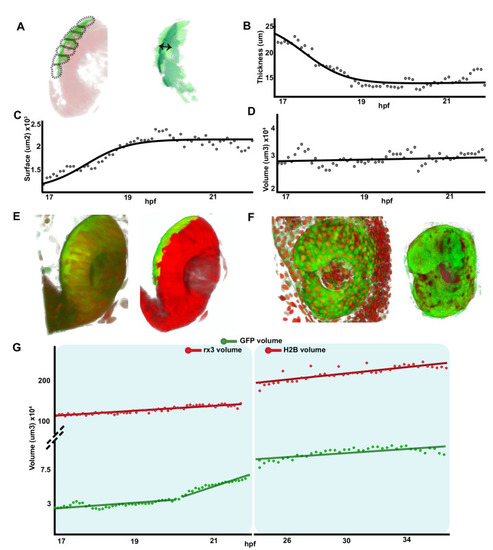
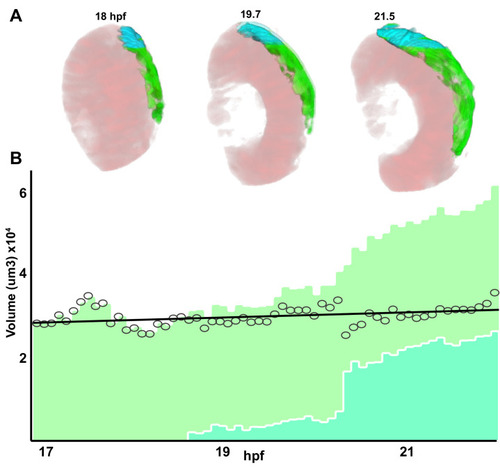
Stretching of the retinal pigment epithelium contributes to zebrafish optic cup morphogenesis

Authors
Moreno-Mármol, T., Ledesma-Terrón, M., Tabanera, N., Martin-Bermejo, M.J., Cardozo, M.J., Cavodeassi, F., Bovolenta, P.
Source
Full text @ Elife

Dorsal view of the optic vesicle (OV) to optic cup (OC) transition visualized in a double Tg(E1-<italic toggle='yes'>bhlhe40</italic>:GFP; <italic toggle='yes'>rx3</italic>:GAL4;UAS:RFP embryo).

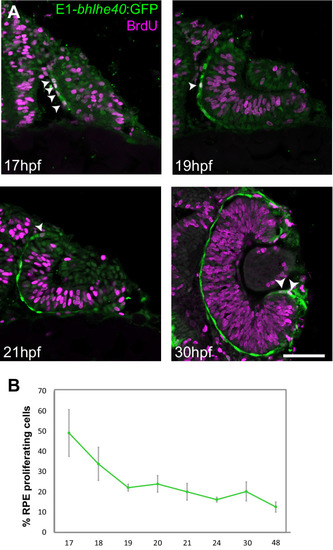
Single confocal section, related to Figure 1, frame rate 1/5 min.

The retinal pigment epithelium (RPE) converts from a pseudostratified to a squamous epithelium during optic vesicle (OV) folding by increasing individual cell surface.

(A–C’) Confocal images of frontal cryo-sections of Tg(E1-bhlhe40:GFP) embryos immunostained for GFP (green) and β-catenin (white) and counterstained with Hoechst (blue). Note that the RPE rapidly decreases its thickness white straight line in (A–C) and cells change from columnar (14 hpf, arrow in A’) to cuboidal (16 hpf, arrow in B’) and then flat shape (22 hpf, arrow in C’). White dashed lines delineate eye contour and virtual lumen in A–C. (D–E’) Confocal images of the posterior RPE (D, D’) and neural retina (NR) (E, E’) regions of an eye cup dissected from 30 hpf Tg(E1-bhlhe40:GFP) embryos immunostained for GFP (green) and β-catenin (white) and counterstained with Hoechst (blue). Images in D’, E’ are high power views of the areas boxed in white box in D, E. Note the hexagonal morphology (yellow arrow in D’) of RPE cells (average area 354.8 ± 100.3 μm2) in contrast to the small and roundish cross-section of retinal progenitors (average area 22.5 ± 2.9 μm2; yellow arrow in E’). (F) The graph represents the average area of individual OV progenitors and NR and RPE cells (n = 15–19). The average area is calculated using cells from five different embryos. Data represent mean ± SD, ****p < 0.0001. ns, non-significant. Scale bar: 50 µm.

The source data 1 is the excell file that is already correcly linked.

Quantification of RPE volume in space and time.

Quantification of RPE volume in space and time.

Retinal pigment epithelium (RPE) flattening is a myosin-dependent cell autonomous process required for proper optic vesicle (OV) folding.

(A–J) Confocal images of dorsally viewed Tg(E1-bhlhe40:GFP) embryos before (17 hpf; A) and 2.5 hr after incubation (19.5 hpf) with either DMSO (B, E, H), blebbistatin (C), paranitroblebbistatin (D), or azidoblebbistatin (Ableb) (F, G, I, J) with (G, J) or without irradiation (F, I) in the prospective RPE (F–G) or neural retina (NR) (I–J). Images in E’, F’, G’ H’, I’, and J’ are high power views of RPE morphology. Embryos were immunostained for GFP (green), β-catenin (white), and counterstained with Hoechst (blue). Note that the optic cup (OC) forms and the RPE flattens (white arrowhead in B) normally in all DMSO-treated embryos (B, E, E,’ H, H’) or in embryos incubated in Ableb without irradiation (F, F’, I, I’). In contrast, the RPE remains cuboidal (white arrowhead in C) and NR cells seem not undergo basal constriction (yellow arrowhead in C) in the presence of myosin inhibitors (C, D). Photoactivation of Ableb in the RPE prevents cell flattening (compare E’, F’, with G’) and impairs OV folding (G). When Ableb is photoactivated in the NR, folding of the OV is also impaired (J) but RPE cells undergo flattening (compare H’, I’, with J’). The number of embryos analysed and showing the illustrated phenotype is indicated on the top right corner of each panel and the average invagination angle and mean A–B on the left bottom corner. The yellow dashed line in (E, H) indicates how the invagination angle (α) was determined. (K, M) Normalized RPE height in DMSO- and Ableb-treated embryos, irradiated either in the RPE (K) or in the NR (M). (L, N) Normalized invagination angle in DMSO- and Ableb-treated embryos irradiated either in the RPE (L) or in the NR (N). Data represent mean ± SD; **p < 0.01 and ***p < 0.001. ns, non-significant. Scale bars: 50 µm in A–J and 25 µm in E’–J’.

Quantification of A-P length and invagination angles reported in <xref rid='fig4' ref-type='fig'>Figure 4K–N</xref>.

EB3-GFP dynamics during retinal pigment epithelium (RPE) cell remodelling.

(A–C) Frames from representative Video 1 showing the orientation of microtubule dynamics in RPE cells with a neuroepithelial (A, continuous acquisition, n = 9), cuboidal (B, continuous acquisition, n = 10), and squamous conformation (C, continuous acquisition, n = 15). Insets provide higher power view of the three images. Scale bar: 25 µm.

Nocodazole treatment does not alter retinal pigment epithelium (RPE) specification and polarity.

(A) DMSO and (B) nocodazole-treated embryos (2.5 hr incubation from 17 to 19.5 hpf, as reported in Figure 5) hybridized with otx1-specific probe. (C) DMSO or (D) nocodazole-treated embryos with mitfa-specific probe. After nocodazole treatment, both mRNAs are specifically detected in the RPE (black arrowheads) despite its morphogenesis is impaired. (E, E’) Wild-type embryos labelled with laminin (green/basal), zo-1 (white/apical), and Hoechst (blue) after DMSO or (F, F’) nocodazole treatment. In both cases apico-basal polarity is maintained (white and green arrowheads), even after depolymerizing microtubules when RPE cells do not flatten correctly. A–D images are dorsal views of flat-mounted embryos. E–F’ images are frontal sections of one eye. Scale bars: 100 µm in A–D and 50 µm in E–F’.

Zebrafish retinal pigment epithelium (RPE) flattening is associated with an abrupt decrease of cell proliferation.

(A) Confocal images of dorsally viewed Tg(E1-bhlhe40:GFP) embryos exposed to 5-bromo-2′-deoxyuridine (BrdU) at different developmental stages as indicated in the panel and immunostained for BrdU (magenta) and GFP (green). (B) Percentage of RPE proliferating cells (BrdU+/total Hoechst +) in 17–48 hpf Tg(E1-bhlhe40:GFP) embryos. Mean ± SD; n = 5 embryos per stage. Scale bar: 100 µm.

Quantification of the RPE proliferating cells at diffrent developmental stages as reported in <xref rid='fig6' ref-type='fig'>Figure 6B</xref>.

Identification of the RPE domain and RPE cell shape in amniotes.

(A) Confocal images of frontal sections from E9.5 and E10.5 mouse embryos co-immunostained for the RPE-specific marker OTX2 (green) and actin (red). Sections were counterstained with Hoeschst (blue). (B) Confocal images of horizontal sections from human embryos at CS15 and P5. The embryonic sections were immunostained for OTX2 (green) and N-cadherin (red) counterstained with Hoeschst (blue). Postnatal sections were immunostained for OTX2 (red). The distribution of OTX2 was used to define the prospective RPE region whereas actin/N-cadherin distribution was used to identify the apico-basal axis of the cells. Scale bars: 100 µm in A and left B panel; 30 µm in B right panel.

Summary of species-specific modes of retinal pigment epithelium (RPE) differentiation and its contribution to optic vesicle (OV) folding.

(A) The drawing on the top represent the dynamic of OV folding into an optic cup (OC). Green double arrow indicated RPE flattening, blue arrow rim involution whereas pink arrows indicate retinal basal constriction. Bottom row summarizes the alterations in OV folding observed after localized interference with RPE and neural retina (NR) cytoskeleton. (B) Schematic representation of the differential mechanisms by which the RPE in zebrafish (upper row) and in amniotes (lower row) expands its surface during OV folding morphogenesis. In zebrafish, the RPE enlarges its surface by cell stretching; in amniotes, including in humans, the RPE instead expands by cell proliferation with a less pronounced need of cell flattening.

Acknowledgments
This image is the copyrighted work of the attributed author or publisher, and ZFIN has permission only to display this image to its users. Additional permissions should be obtained from the applicable author or publisher of the image. Full text @ Elife