
- Title
-
Developmental Angiogenesis Requires the Mitochondrial Phenylalanyl-tRNA Synthetase
- Authors
- Li, B., Chen, K., Liu, F., Zhang, J., Chen, X., Chen, T., Chen, Q., Yao, Y., Hu, W., Wang, L., Wu, Y.
- Source
- Full text @ Front Cardiovasc Med
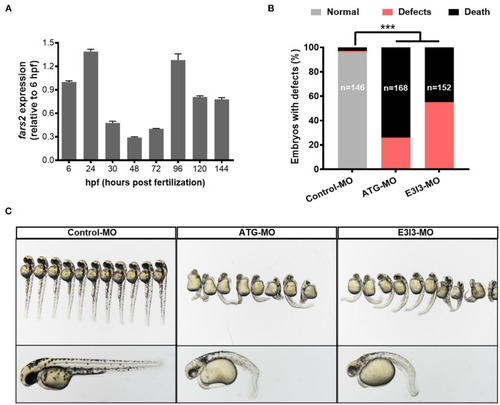
The expression of |
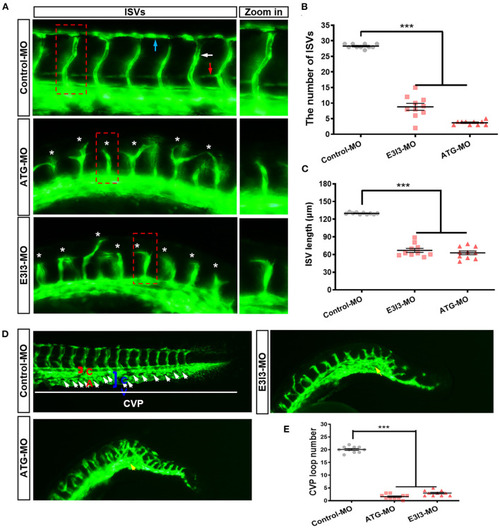
The morpholino-mediated knock-down of PHENOTYPE:
|
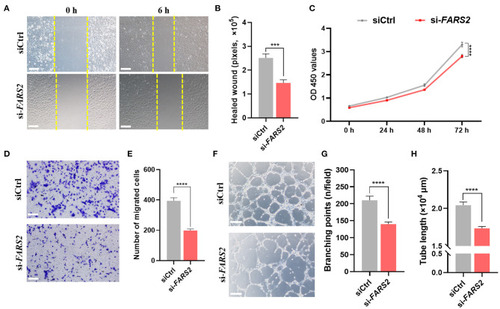
The deficiency of FARS2 impairs cell motility, proliferation, invasion, and tube formation in human umbilical vein endothelial cells (HUVECs). |
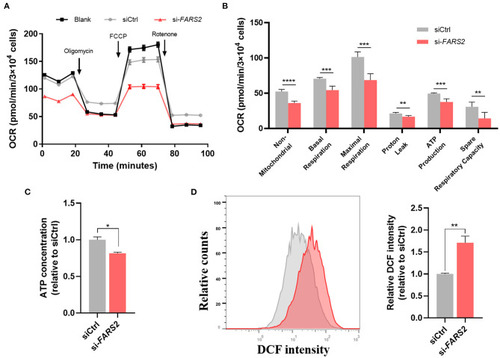
|
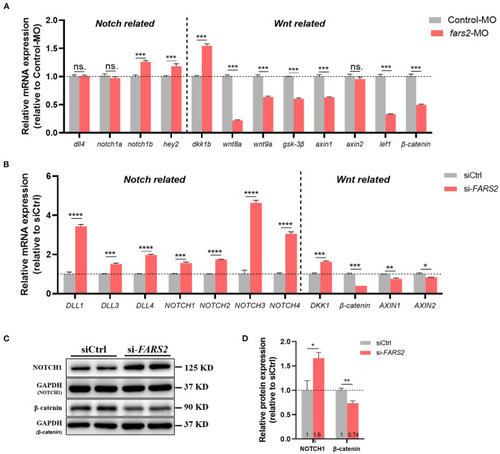
The deficiency of FARS2 impairs angiogenesis by disrupting the Notch and Wnt signaling pathways. |
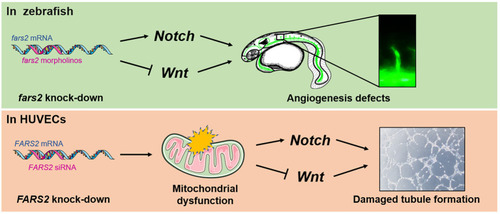
Developmental angiogenesis requires the mitochondrial phenylalanyl-tRNA synthetase. An overview of the mechanisms by which the deficiency of mitochondrial phenylalanyl-tRNA synthetase impairs angiogenesis by disrupting the |