
- Title
-
Gene co-expression network analysis in zebrafish reveals chemical class specific modules
- Authors
- Shankar, P., McClure, R.S., Waters, K.M., Tanguay, R.L.
- Source
- Full text @ BMC Genomics

Heatmap of 48-hpf zebrafish transcriptomic response to ten Flame Retardant Chemical (FRC), 22 Polycyclic Aromatic Hydrocarbon (PAH), and 1 TCDD treatment. Average log2 fold change (log2FC) values for each chemical treatment (y-axis) are shown, with yellow indicating higher expression and blue indicating lower expression compared to each chemical’s DMSO control. Both genes and treatments are grouped via hierarchical clustering with clusters of treatments (Clusters 1–6) indicated by colors on the left |

Gene co-expression network of 48-hpf zebrafish transcriptomic response to chemicals. Small colored circles represent zebrafish genes (nodes), and lines (edges) connecting the genes represent instances of high co-expression. Nodes are colored by the module they belong to with processes highly enriched in four example modules indicated |

Network response to FRCs and AHR2 Activators. A Nodes are colored and sized by the number of FRCs they respond to (defined as an FDR p-value < 0.05 when comparing chemical to DMSO control, no fold-change cutoff). Larger green nodes respond to a more chemicals, smaller brown nodes respond to fewer chemicals. General location of modules highly associated with FRCs (Modules 1, 2, 6, 7, and 10) are indicated. B Same as (A) but showing response to AHR2 Activators. Location of Module 13, highly associated with the AHR2 Activators, is indicated |
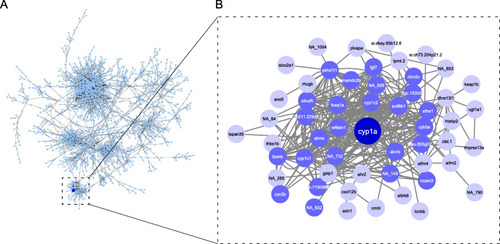
Network neighborhood of |

Heatmap of chemical response of genes in the first-degree network neighborhood of cyp1a. Genes are shown on the right (y-axis) and chemicals below (x-axis). Both genes and chemicals are clustered by similarity of response. Yellow indicates higher expression of each gene in chemical treatment compared to respective DMSO control, blue indicates lower expression in chemical treatment compared to respective DMSO control |
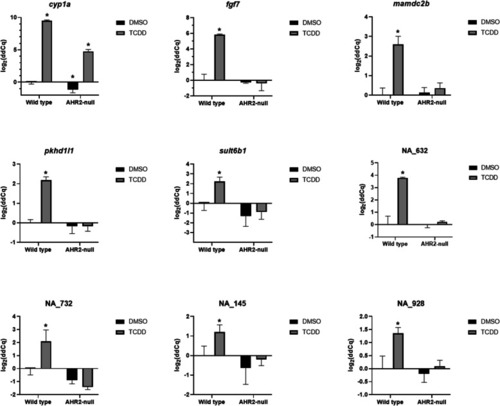
Validation of cyp1a network neighborhood genes identified from the network analysis. Comparative gene expression of cyp1a and selected cyp1a network neighborhood genes in 48-hpf wildtype and AHR2 mutant zebrafish developmentally exposed to 0.1% DMSO or 1 ng/mL TCDD (n = 3–4 biological replicates). Beta-actin was used as the normalization control. Error bars indicate SD of the mean. * = p-value < 0.05 compared to the wildtype vehicle control (DMSO). Statistical significance was determined using a Kruskal Wallis rank sum test followed by a Dunnett’s test for data that were not normal (NA_732), or a two-way ANOVA followed by a Tukey test for data that were normal (all other genes) |