
Image
|
Figure Caption
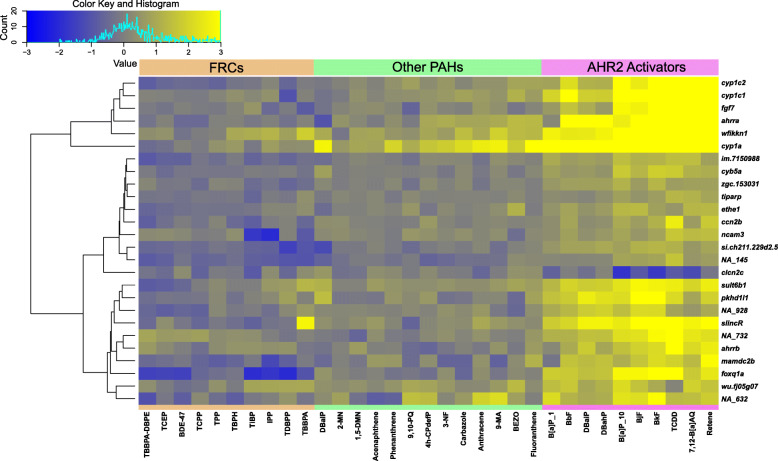
Fig. 5
Heatmap of chemical response of genes in the first-degree network neighborhood of cyp1a. Genes are shown on the right (y-axis) and chemicals below (x-axis). Both genes and chemicals are clustered by similarity of response. Yellow indicates higher expression of each gene in chemical treatment compared to respective DMSO control, blue indicates lower expression in chemical treatment compared to respective DMSO control
Acknowledgments
This image is the copyrighted work of the attributed author or publisher, and
ZFIN has permission only to display this image to its users.
Additional permissions should be obtained from the applicable author or publisher of the image.
Full text @ BMC Genomics