FIGURE

Fig. 4

ID
ZDB-FIG-210919-12
Publication
Shankar et al., 2021 - Gene co-expression network analysis in zebrafish reveals chemical class specific modules
Other Figures
All Figure Page
Back to All Figure Page
Fig. 4

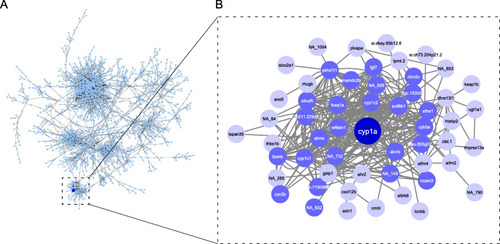
Network neighborhood of cyp1a. A The full network is shown with each blue circle (node) representing a zebrafish gene (2141 nodes are shown which represent the main network), and each line representing an edge (4373 edges are shown which represent the main network). The dark blue node represents cyp1a. B A subset network showing the network neighborhood of cyp1a. The cyp1a gene is in dark blue, nodes in blue represent those in the first-degree network neighborhood (directly linked to cyp1a through an edge). Nodes in light blue represent those in the second-degree network neighborhood (linked to cyp1a through one additional gene within the first network neighborhood)

Expression Data

Expression Detail
Antibody Labeling
Phenotype Data

Phenotype Detail
Acknowledgments
This image is the copyrighted work of the attributed author or publisher, and ZFIN has permission only to display this image to its users. Additional permissions should be obtained from the applicable author or publisher of the image. Full text @ BMC Genomics