
|
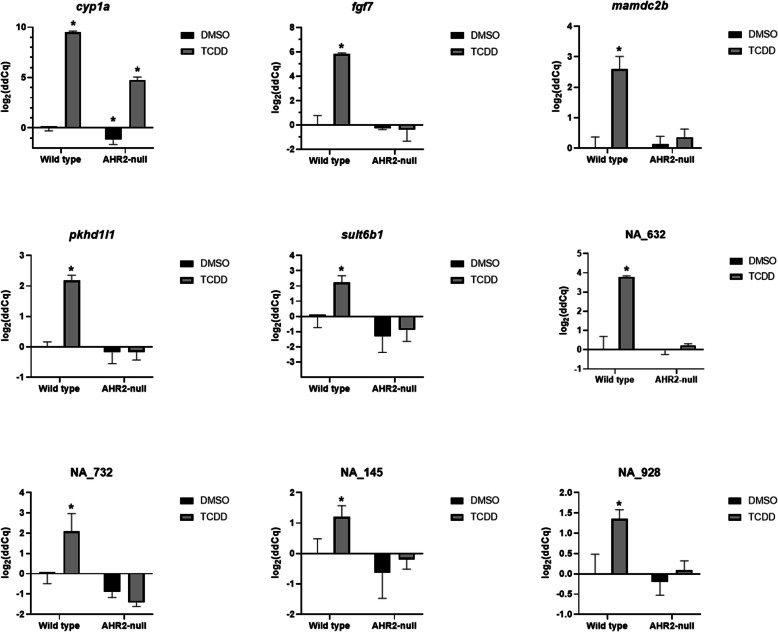
Fig. 6
Validation of cyp1a network neighborhood genes identified from the network analysis. Comparative gene expression of cyp1a and selected cyp1a network neighborhood genes in 48-hpf wildtype and AHR2 mutant zebrafish developmentally exposed to 0.1% DMSO or 1 ng/mL TCDD (n = 3–4 biological replicates). Beta-actin was used as the normalization control. Error bars indicate SD of the mean. * = p-value < 0.05 compared to the wildtype vehicle control (DMSO). Statistical significance was determined using a Kruskal Wallis rank sum test followed by a Dunnett’s test for data that were not normal (NA_732), or a two-way ANOVA followed by a Tukey test for data that were normal (all other genes)