
- Title
-
Zebrafish Bioassay for Screening Therapeutic Candidates Based on Melanotrophic Activity
- Authors
- Hong, T.I., Hwang, K.S., Choi, T.I., Kleinau, G., Scheerer, P., Bang, J.K., Jung, S.H., Kim, C.H.
- Source
- Full text @ Int. J. Mol. Sci.
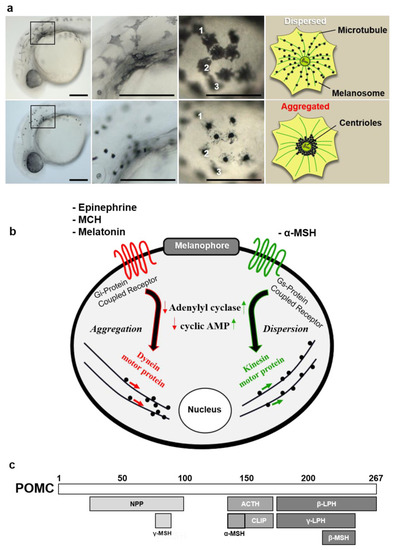
Characteristic features of zebrafish melanophore physiology. (a) High-resolution magnification of larval melanophores before and after treatment with the aggregating agent. Numbers (1, 2, 3) indicate individual melanophores two minutes after melatonin treatment. Schematic describes movement of melanosomes during aggregation process. Scale bars: 100 µm. (b) Diagram of melanophore pigment cell showing major intracellular events following receptor-ligand binding of aggregating/dispersive agents. (c) Schematic showing POMC gene product and derivative molecules generated by post-translational processing. Abbreviations: mch: melanin-concentrating hormone, npp: N-terminal peptide of proopiomelanocortin, clip: corticotropin-like intermediate peptide, lph: lipotropin. |
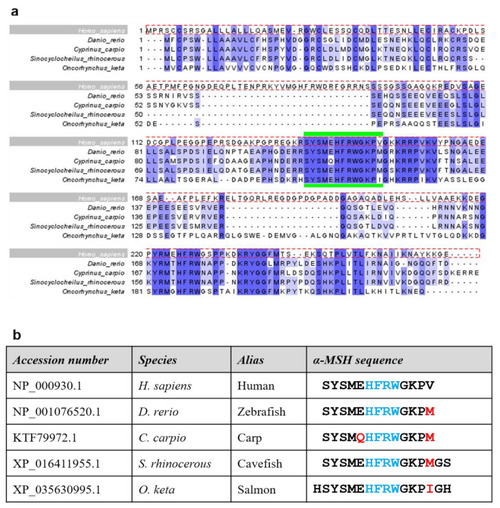
Sequence analysis and alignment of naturally-occurring α-MSH variants. (a) Clustal Omega alignment of four α-MSH variants in different species with human sequence as reference (dotted red box). Percentage Identity color scheme. The region demarcated by green bars indicates the 13-amino-acid α-MSH peptide. (b) Table listing the accession number of each α-MSH form used in the melanophore assay, including aliases for each species. The α-MSH sequences indicate the sequence of generated peptides; red letters indicate amino acid variations within the α-MSH peptide, while blue represents the HFRW motif. |

Yolk sac melanophores of developing zebrafish larvae. (a) Table of images depicting zebrafish larva developmental stages according to the number of hours post fertilization (hpf) with magnification of the yolk-sac region. (b) Quantification of average area of yolk sac melanophores at 3 h intervals starting from 48 hpf to 60 hpf for wild-type zebrafish. One-way ANOVA with post-hoc Dunn’s multiple comparison test was used for statistical significance between groups; data represented as mean ± SEM; * p < 0.05, *** p < 0.001, ns = not significant. |

Melanophore dish assay comparing α-MSH variants from different species. (a) Schematic of melanophore dish assay with wild-type (WT) larvae. Red asterisks indicate imaging timepoints. (b) Results of melanophore dish assay comparing mean melanophore area (n = 30–50 melanophores from 3–5 larvae) calculated after induction of melanosome dispersion by treatment of the respective α-MSH peptide. One-way ANOVA with post-hoc Dunn’s multiple comparison test was used for statistical significance between groups; data represented as mean ± SEM; *** p < 0.001, ns = not significant. (c) Normalization of mean melanophore area by initial area of the control group (see Equation (1)). |

Melanophore restriction array assay comparing human α-MSH and MT-II. ( |

Molecular model of α-MSH and zebrafish MC1R complex. The MC1R (carton representation) binds α-MSH in a cavity between the extracellular loops (ELs) and the transmembrane helices (TMs). Visualized are amino acids (sticks) covering the ligand binding site and are highly important for ligand and co-factor calcium (Ca2+) binding. All α-MSH ligand variants from different species share a conserved core motif (HRFW) involved in receptor-ligand contacts. The α-MSH C-terminus with position 13 (M13) is not in direct contact with the receptor as supposed by MC4R/α-MSH or MC1R/α-MSH complexes. |