FIGURE SUMMARY
Title

Y705 and S727 are required for mitochondrial import and transcriptional activities of STAT3 and regulate proliferation of embryonic and tissue stem cells

Authors
Peron, M., Dinarello, A., Meneghetti, G., Martorano, L., Betto, R.M., Facchinello, N., Tesoriere, A., Tiso, N., Martello, G., Argenton, F.
Source
Full text @ Development

Stat3 mRNA is co-expressed with proliferation and mtDNA transcription markers in the TeO of zebrafish embryos. (A) WISH on 48 hpf zebrafish WT embryos using pcna (dark green frame and outline), mt_nd2 (light green frame and outline) and stat3 (yellow frame and outline) antisense mRNA probes shows co-expression of the three transcripts in the PML region of the TeO. PML, peripheral midbrain layer; r, retina. (B) IF against Pcna (green) and FISH with pcna antisense mRNA probe (red). (C) IF against Pcna (green) and FISH with mt_nd2 antisense mRNA probe (red). (D) IF against Pcna (green) and FISH with stat3 antisense mRNA probe (red). Images are representative of the 90% of processed samples. Scale bars: 100 μm.

mitoSTAT3 regulates proliferation through mitochondrial DNA transcription. (A-A″) WISH with anti-mt_nd2 mRNA probe representing mitochondrial gene transcription in uninjected embryos (A), embryos injected with MLS_mStat3_NES mRNA (A′) and injected embryos treated with 50 µM Balapiravir (A″). (B-B″) FISH with pcna probe in the TeO of uninjected embryos (B), embryos injected with MLS_mStat3_NES mRNA (B′) and injected embryos treated with 50 µM Balapiravir (B″). (C) qRT-PCR showing mt_nd2 gene expression after injection of MLS_mStat3_NES mRNA and treatment with Balapiravir at 48 h post injection; zgapdh was used as internal control. (D) Fluorescence quantification of pcna mRNA expression in the TeO (n=12). (E) Relative amount of mtDNA in embryos injected with MLS_mStat3_NES mRNA and uninjected controls at 48 hpf. Mean dCt values were calculated as Ct of mt_nd1 (mitochondrial-encoded gene) minus Ct of polg1 (nuclear-encoded gene). Data are mean±s.e.m. *P<0.05; **P<0.01; ***P<0.001 (unpaired two-tailed t-test on three independent biological samples, where n not specified). ns, not significant. Scale bars: 200 μm in A; 100 μm in B.

Mutation of Stat3 DBD (DNA binding domain) does not affect its mitochondrial activities. (A) WISH with anti-mt_nd2 antisense probe in uninjected 48 hpf larvae and in 48 hpf larvae injected with MLS_mStat3_NES or MLS_mStat3_ΔDNAbd_NES mRNA. (B) qRT-PCR showing mt_nd2 gene expression after injection of MLS_mStat3_NES or MLS_mStat3_ΔDNAbd_NES mRNA in 48 hpf embryos; zgapdh was used as internal control. (C) IF on ESCs transiently transfected with MLS_mStat3_NES or MLS_mStat3_ΔDNAbd_NES and stained with anti-STAT3 (green), anti-ATAD3 (red) antibodies and DAPI (blue). Data are mean±s.e.m. *P<0.05; **P<0.01 (unpaired two-tailed t-test on three independent biological samples, where n not specified). Scale bars: 200 μm.

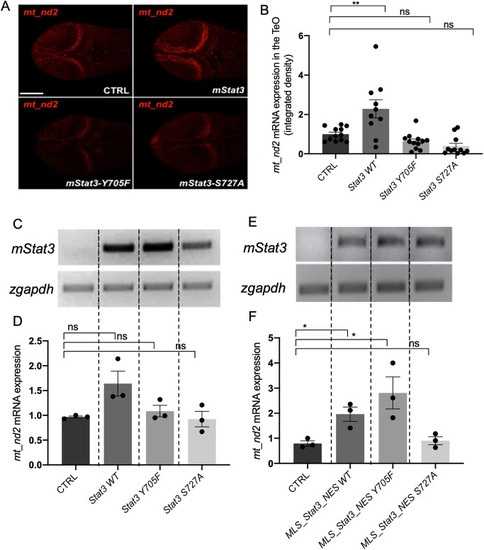
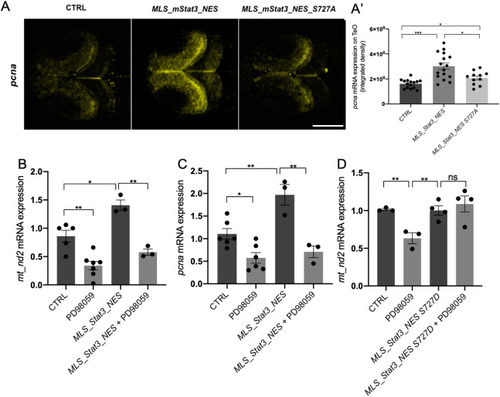
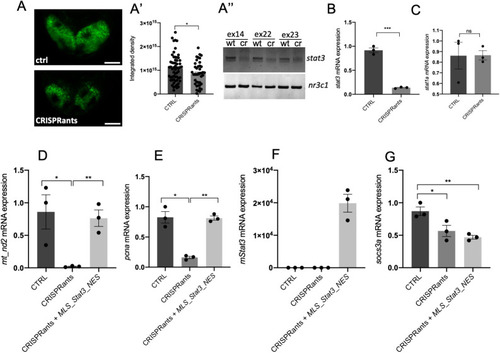
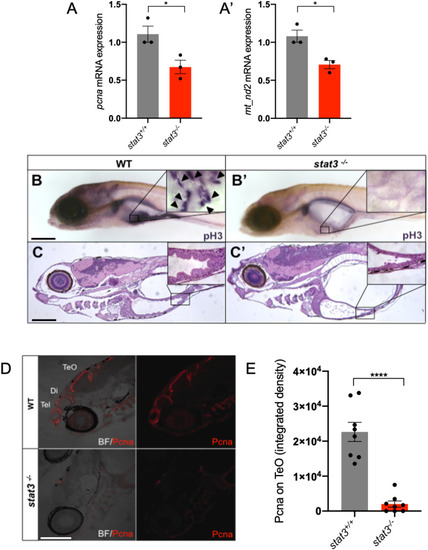
mitoSTAT3 transcriptional activity relies on both S727 and Y705 phosphorylation. (A) FISH with mt_nd2 probe in the TeO of 48 hpf embryos injected with mRNA encoding the indicated mutated forms of mStat3. (B) Fluorescence quantification of mt_nd2 mRNA expression in the TeO (n=10). (C) RT-PCR analysis of mStat3 transcripts detected at 48 hpf in embryos injected with the indicated form of mStat3 mRNA; zgapdh was used as internal control. (D) qRT-PCR analysis of mt_nd2 transcript levels at 48 hpf normalised to zgapdh. (E) RT-PCR analysis of MLS_mStat3_NES transcripts detected at 48 hpf in embryos injected with indicated form of mitochondria-targeted mStat3 mRNA; zgapdh was used as internal control. (F) qRT-PCR analysis of mt_nd2 transcript levels at 48 hpf normalised to zgapdh. Data are mean±s.e.m. *P<0.05; **P<0.01 (unpaired two-tailed t-test on three independent biological samples, where n not specified). ns, not significant. Scale bar: 100 μm.

Y705 phosphorylation is needed for the correct localisation of STAT3 in the mitochondrion. (A) IF with anti-STAT3 and anti-ATAD3 antibodies on ESCs transiently transfected with either mStat3, mStat3 Y705F or MLS_mStat3_NES Y705F. Arrowheads indicate the colocalisation of ATAD and STAT3. (B) Western blot of total STAT3 in ESC extracts; β-actin was used as a loading control. (C) Western blot of mitochondrial STAT3 from ESC mitochondrial extracts; VDAC1 was used as a mitochondrial loading control, Lamin was used as a control for nuclear contamination. (D) Representative pictures of DAB IHC on ESCs acquired with TEM; positive signal is black and negative is white. Cristae are positive in Stat3 WT and MLS_Stat3_NES transfected cells. m, mitochondria; n, nucleus. Scale bar: 200 μm (A).

mitoSTAT3-dependent activation of cell proliferation in the TeO depends on S727 phosphorylation. (A,A′) Representative images of WISH performed with an anti-pcna probe on 48 hpf uninjected larvae, larvae injected with MLS_mStat3_NES or MLS_mStat3_NES S727A mRNAs (A). Fluorescence quantification of pcna mRNA expression in the TeO (n=12) (A′). (B) qRT-PCR analysis of mt_nd2 in uninjected 48 hpf larvae and larvae injected with MLS_mStat3_NES mRNA treated or untreated with PD98059 for 24 h. (C) qRT-PCR analysis of pcna in uninjected 48 hpf larvae and larvae injected with MLS_mStat3_NES mRNA treated either with PD98059 12.5 µM or DMSO for 24 h. (D) qRT-PCR analysis of mt_nd2 in uninjected 48-hpf larvae and larvae injected with MLS_mStat3_NES S727D mRNA treated or untreated with PD98059 for 24 h. actb1 was used as an internal control. Data are mean±s.e.m. *P<0.05; **P<0.01; ***P<0.001 (unpaired two-tailed t-test on three independent biological samples, where n not specified). ns, not significant. Scale bar: 100 μm.

JAK inhibition impairs normal mitochondrial transcription and cell proliferation in the TeO of 72 hpf embryos. (A) WISH with anti-mt_nd2 mRNA probe on 72 hpf embryos treated with 100 µM AG490 from 24-72 hpf and DMSO-treated controls. (B) Relative mt_nd2 transcript expression assayed by qRT-PCR in 48 and 72 hpf embryos treated with 100 µM AG490 and DMSO-treated controls starting from 24 hpf; zgapdh was used as internal control (P-values=0.6261; 0.0060). (C) FISH with anti-pcna probe in the TeO of 72 hpf embryos treated with 100 µM AG490 from 24 to 72 hpf and DMSO-treated controls. (D) Fluorescence quantification of pcna mRNA expression in the TeO (n=6) (P-value=0.0003). Data are mean±s.e.m. **P<0.01; ***P<0.001 (unpaired two-tailed t-test on three independent biological samples, where n not specified). ns, not significant. Scale bars: 200 μm in A; 100 μm in C.

JAK inhibition impairs normal mitochondrial transcription and cell proliferation in the intestine of 6 dpf larvae. (A) WISH with anti-mt_nd2 mRNA probe on 6 dpf larvae treated with 60 µM AG490 from 24 to 72 hpf and DMSO-treated controls; zoom on the intestine. (B) Quantification of mt_nd2 mRNA expression in the intestine (n=30). (C) Phospho-Histone-H3 (pH3) immunostaining of 6 dpf AG490-treated larvae and DMSO-treated controls; inset shows magnification of boxed area of intestine. Arrowheads indicate pH3-positive cells. (D) Quantification of the number of AG490- and DMSO-treated larvae displaying intestinal proliferation (n=15). (E) AG490-treated larvae showing loss of folding in intestinal mucosa. (F) Graph showing the dimension of mucosal thickness in both DMSO- and AG490-treated 6 dpf larvae (n=18). Data are mean±s.e.m. *P<0.05; **P<0.01; ***P<0.001 (unpaired two-tailed t-test on indicated number of samples). Scale bars: 200 μm in A,C; 100 μm in E.

stat3 CRISPRants show reduced mitochondrial transcription that is rescued by mitochondrial Stat3. (A-A″) Representative images of 48 hpf Tg(7xStat3-Hsv.Ul23:EGFP)ia28 transgenic zebrafish larvae (A). Fluorescent quantification of TeO of control and CRISPRant zebrafish larvae (A′). PCR amplification of the stat3 gene on DNA extracts from control (wt) and CRISPRant (cr) larvae (nr3c1 gene is used as an internal control) (A″). (B) qRT-PCR against stat3 in 48 hpf control larvae and CRISPRants. (C) qRT-PCR against stat1a in 48 hpf control larvae and CRISPRants. (D) qRT-PCR against mt_nd2 in 48 hpf control, CRISPRants and CRISPRants+MLS_mStat3_NES mRNA zebrafish larvae. (E) qRT-PCR against pcna in 48 hpf control, CRISPRants and CRISPRants+MLS_mStat3_NES mRNA zebrafish larvae. (F) qRT-PCR against Stat3 in 48 hpf control, CRISPRants and CRISPRants+MLS_mStat3_NES mRNA zebrafish larvae. (G) qRT-PCR against socs3a in 48 hpf control, CRISPRants and CRISPRants+MLS_mStat3_NES mRNA zebrafish larvae. actb1 was used as an internal control. Data are mean±s.e.m. *P<0.05; **P<0.01; ***P<0.001 (unpaired two-tailed t-test on three independent biological samples, where n not specified). ns, not significant. Scale bar: 50 μm.

stat3 knockout impairs normal mitochondrial transcription and cell proliferation in the intestine and brain of 6 dpf zebrafish larvae. (A,A′) Relative mRNA expression of pcna (A) and mt_nd2 (A′) transcripts assayed by qRT-PCR in homogenised stat3−/− and WT siblings at 6 dpf; zgapdh was used as internal control (P-values=0.0358; 0.0182). (B,B′) Phospho-Histone-H3 (pH3) immunostaining of WT (B) and stat3−/− (B′) siblings at 6 dpf; inset shows magnification of boxed area of intestine. Arrowheads indicate pH3-positive cells. (C,C′) Hematoxylin and Eosin (H&E) staining on WT (C) and stat3−/− (C′) mutant sections at 6 dpf shows the complete loss of folding in the mutant intestinal epithelium; inset shows magnification of boxed area of intestine. (D) IF with anti-PCNA antibody on 6 dpf stat3−/− mutants showing decrease of fluorescence in the CNS (BF, bright field; Di, diencephalon; Tel, telencephalon; TeO, tectum opticum). (E) Fluorescence quantification of Pcna protein on lateral sections of 6 dpf stat3−/− mutants and WT siblings (n=8). Data are mean±s.e.m. *P<0.05; ****P<0.0001 (unpaired two-tailed t-test on three independent biological samples, where n not specified). Scale bars: 200 μm.

Acknowledgments
This image is the copyrighted work of the attributed author or publisher, and ZFIN has permission only to display this image to its users. Additional permissions should be obtained from the applicable author or publisher of the image. Full text @ Development