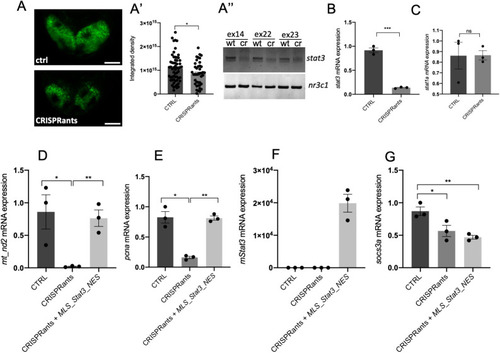
stat3 CRISPRants show reduced mitochondrial transcription that is rescued by mitochondrial Stat3. (A-A″) Representative images of 48 hpf Tg(7xStat3-Hsv.Ul23:EGFP)ia28 transgenic zebrafish larvae (A). Fluorescent quantification of TeO of control and CRISPRant zebrafish larvae (A′). PCR amplification of the stat3 gene on DNA extracts from control (wt) and CRISPRant (cr) larvae (nr3c1 gene is used as an internal control) (A″). (B) qRT-PCR against stat3 in 48 hpf control larvae and CRISPRants. (C) qRT-PCR against stat1a in 48 hpf control larvae and CRISPRants. (D) qRT-PCR against mt_nd2 in 48 hpf control, CRISPRants and CRISPRants+MLS_mStat3_NES mRNA zebrafish larvae. (E) qRT-PCR against pcna in 48 hpf control, CRISPRants and CRISPRants+MLS_mStat3_NES mRNA zebrafish larvae. (F) qRT-PCR against Stat3 in 48 hpf control, CRISPRants and CRISPRants+MLS_mStat3_NES mRNA zebrafish larvae. (G) qRT-PCR against socs3a in 48 hpf control, CRISPRants and CRISPRants+MLS_mStat3_NES mRNA zebrafish larvae. actb1 was used as an internal control. Data are mean±s.e.m. *P<0.05; **P<0.01; ***P<0.001 (unpaired two-tailed t-test on three independent biological samples, where n not specified). ns, not significant. Scale bar: 50 μm.
|
