
- Title
-
3D assessment of intervertebral disc degeneration in zebrafish identifies changes in bone density that prime disc disease
- Authors
- Kague, E., Turci, F., Newman, E., Yang, Y., Brown, K.R., Aglan, M.S., Otaify, G.A., Temtamy, S.A., Ruiz-Perez, V.L., Cross, S., Royall, C.P., Witten, P.E., Hammond, C.L.
- Source
- Full text @ Bone Res
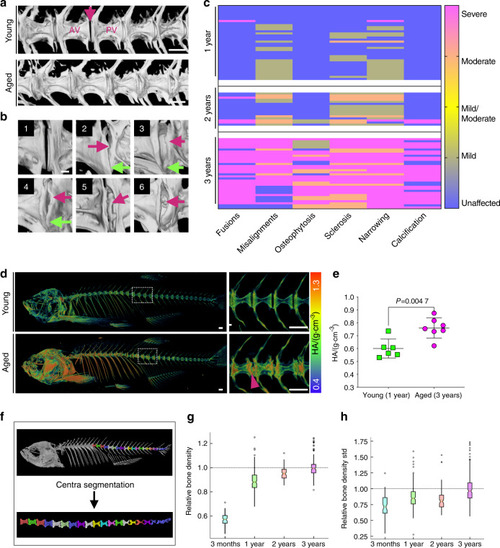
Progressive abnormalities found in aged zebrafish vertebral columns. |
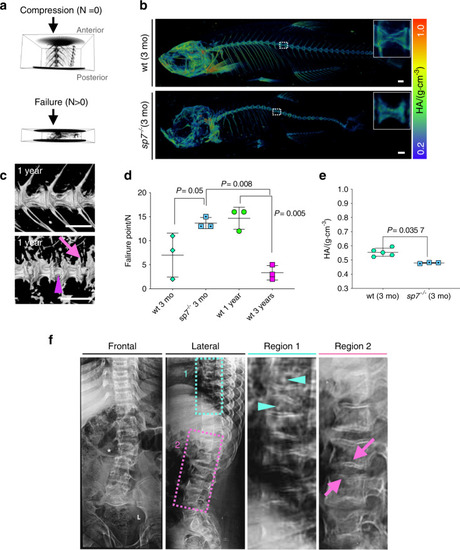
Altered vertebral column biomechanics in aged and PHENOTYPE:
|
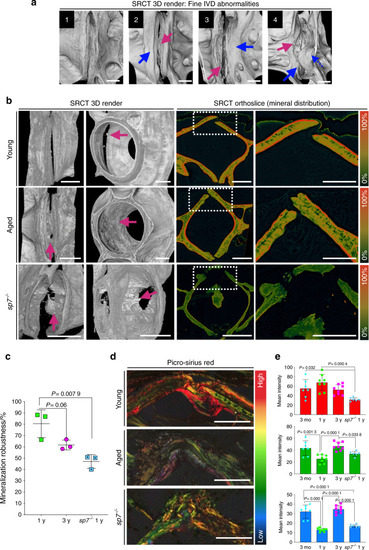
SRCT reveals subtle bone morphological abnormalities and alterations in mineral density distribution. PHENOTYPE:
|
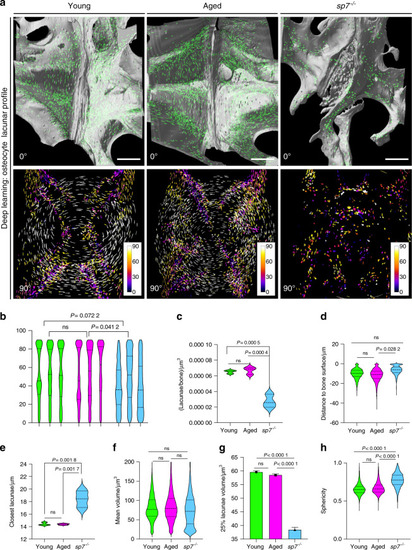
The osteocyte lacunar profile is unchanged in aged fishbut is dramatically compromised in young |

IVDD histopathology underlying 3D disc changes in zebrafish. |
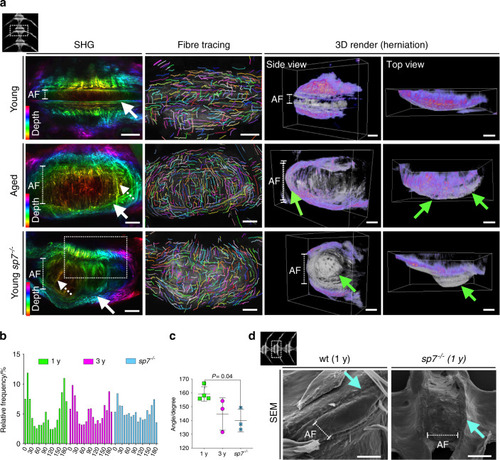
Altered collagen fiber organization and disc herniation in zebrafish IVDD. PHENOTYPE:
|
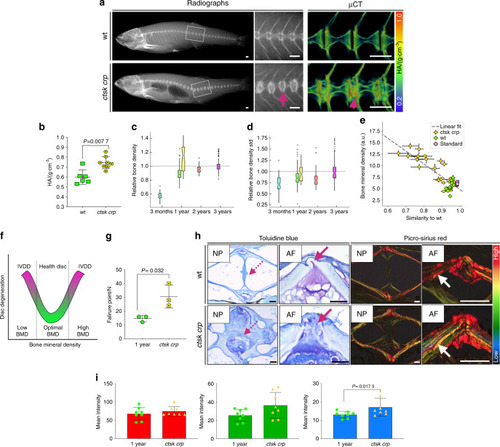
Increased bone density in PHENOTYPE:
|