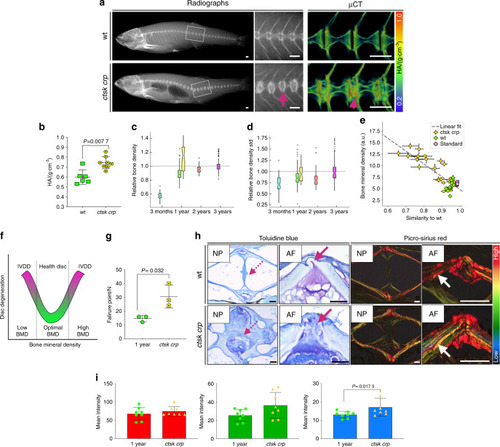
Increased bone density in cathepsin K crp accompanied by premature IVDD. A Radiographs and 3D volumetric rendering from μCT images of 1-year-old wt zebrafish and 1-year-old ctsk crps, color coded for bone density (TMD). Note the dramatic IVD calcification in ctsk crps (arrow). Scale bars = 500 μm. B TMD showing differential density in ctsk crps [wt n = 6 (3 males, 3 females), ctsk crpsn = 8 (4 males, 4 females)]. Standard fish lengths: wt = 3.5 (0.3 SD); ctsk crp = 3.5 cm (0.09 SD). The graph was generated in Prism 8. Nonparametric, two-tailed, Mann–Whitney test; data are the mean and SD. P values are indicated. C Relative bone density from the vertebral centra in aging fish. The notch plot was scaled by the average value from the 3-year-old centra (cyan = 3 months wt; green = 1-year old wt; yellow = 1-year-old ctsk crps; orange = 2-year-old wt; magenta = 3-year-old wt). The graph was generated in Python. D Within-sample standard deviation if bone density. The notch plot was scaled by its average value from the 3-year-old centra (cyan = 3-month-old wt; green = 1-year-old wt; yellow = 1-year-old ctsk crp; orange = 2-year-old wt; magenta = 3-year-old wt). The graph was generated in Python. E Cross-correlation between mineral density and wt morphology of the discs was calculated for wt, ctsk crp and wt standard samples. Pearson correlation coefficient = −0.85, P = 7.8e−14. The graph was generated in Python. F Proposed U-shaped model to describe the association between BMD and IVDD. Either an abnormal increase or decrease in BMD is linked to IVDD. G Failure point during vertebral compression. Nonparametric, two-tailed, t-tests; data are the mean and SD. P values are indicated. The graph was generated in Prism 8. H Histological sections of wt and ctsk crp (1 year) zebrafish stained with toluidine blue and picrosirius red, with a focus on the NP and AF regions. Higher magnification of the AF from another histological section is shown on the right. Disorganized NP (dashed arrows, toluidine blue) and abnormal AF, displaying loss of the elastin layer (arrows, toluidine blue), were detected in the affected IVD of ctsk crps. Picrosirius red staining shows different colors in the bone of ctsk crps (higher magnification), indicating bone quality impairment (white arrow). Scale bars = 50 μm. I Quantification of the thickness of collagen fibers from picrosirius red staining (blue = thin, green = medium, red = thick) (1-year-old n = 8, ctsk crpn = 8). Parametric, two-tailed, T-test; data are the mean and SD. P values are indicated. The graph was generated in Prism 8
|
