
- Title
-
ExpressHeart: Web Portal to Visualize Transcriptome Profiles of Non-Cardiomyocyte Cells
- Authors
- Li, G., Luan, C., Dong, Y., Xie, Y., Zentz, S.C., Zelt, R., Roach, J., Liu, J., Qian, L., Li, Y., Yang, Y.
- Source
- Full text @ Int. J. Mol. Sci.
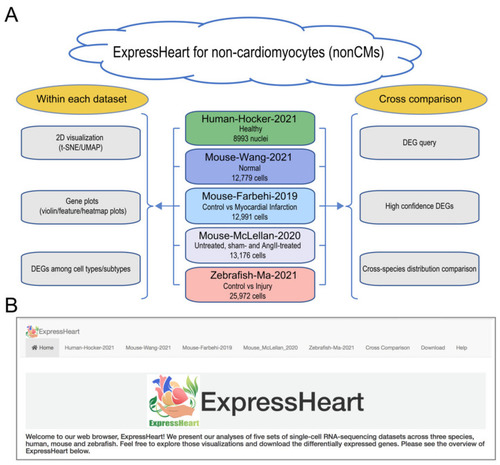
Overview of ExpressHeart. (A) Framework and (B) interface of ExpressHeart. ExpressHeart contains five scRNA-seq or snRNA-seq datasets (middle of panel A). These datasets are named by the last name of the first author, species, and the year of the corresponding publication or data release. The conditions and numbers of cells/nuclei are also presented in each dataset. On the left of panel A, we show three types of visualization and/or analysis within each dataset, including 2D visualization, gene plots via violin/feature/heatmap, and DEGs among cell types/subtypes. On the right of panel A, we show three types of visualization and/or analyses across different datasets. We provide a module (“Cross-comparison”) for DEG query across all datasets, where we report high confidence DEGs across multiple datasets within the same species for major cell types and compare homolog gene distribution across different species. Panel B shows the interface of the web portal. Each dataset has its own analysis and visualization module, using the same names specified in panel A. “Cross-comparison” module corresponds to three sub-modules showed in the right of panel A. |
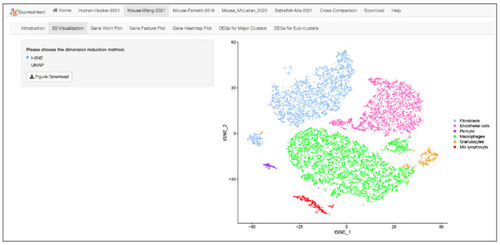
Interface of 2D visualization via UMAP/t-SNE for the Mouse-Wang-2021 dataset. On the left panel, users can choose different dimension reduction methods; the corresponding 2D UMAP/t-SNE plot is presented on the right. Each dot represents a cell/nucleus, and different colors correspond to different cell types. |
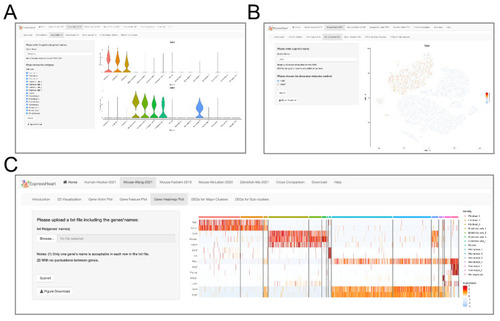
Interfaces of gene expression levels via (A) violin plot, (B) feature plot, and (C) heatmap. On the left panel of each interface, uses can specify a gene of interest for violin plot (A) or feature plot (B), or upload a text file containing a list of genes of interest for heatmap visualization (C). After clicking the “Submit” button, the corresponding violin/feature/heatmap plot for the target gene(s) will show on the right panel. |
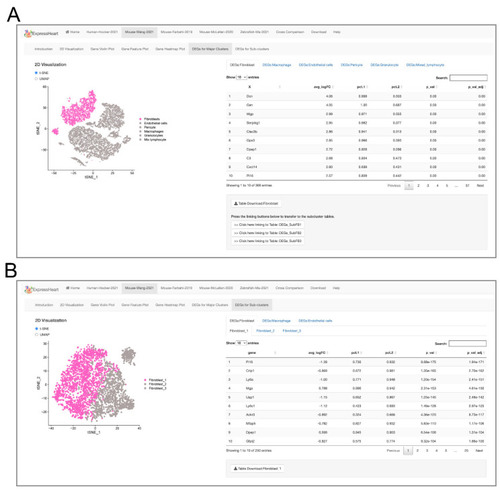
Interfaces of DEG lists for (A) each major cell type versus the other cell types, and (B) each subtype versus the other subtypes the same major cell type. On the left panel of each interface, the UMAP/t-SNE plot highlighting the target major cell type (A) or subtype (B) is presented, and the corresponding DEGs are listed in a table on the right. |

Upset plots of DEGs for three cell types combined (A) and fibroblast (C) between Mouse-Wang-2021 and Mouse-Farbehi-2019 datasets. Here, a total of 741 high confidence DEGs are detected for three cell types (fibroblasts, endothelial cells, and macrophages), including 329 DEGs for fibroblast. (B) Feature GO terms enriched for the high confidence DEGs of fibroblasts (upper panel), endothelial cells (middle panel), and macrophages (bottom panel). The dashed line represents the significance threshold of −log10(0.05). |
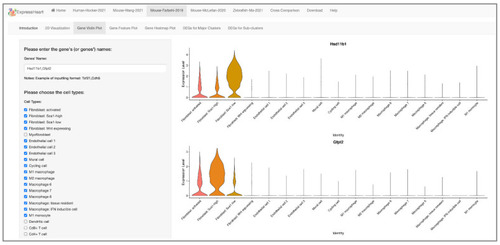
Comparison between two mice datasets. The two violin plots show the expression profiles of the feature genes of two fibroblast subtypes (Hsd11b1 and Gfpt2, respectively) in the Mouse-Wang-2021 dataset in the major subtypes identified in the Mouse-Farbehi-2019 dataset. Users can type in the name(s) of target gene(s) and choose the cell type(s) of interest by checking the corresponding box(es) on the left panel, and the violin plot(s) showing the gene expression level will be presented on the right. |
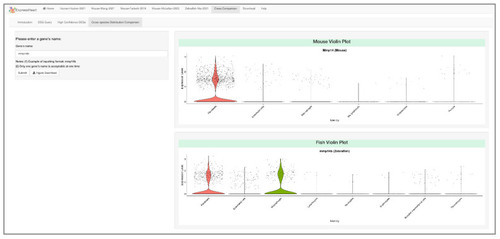
Cross-species comparison between mouse and zebrafish datasets. Users can input the homolog gene name on the left panel, and the corresponding violin plots for the homolog genes (mmp14b in zebrafish, and Mmp14 in mouse) are shown on the right. Here, mmp14b is expressed in 28.0% and 27.8% of fibroblasts and macrophages of zebrafish, while its homolog gene Mmp14 is expressed in a similar proportion of fibroblasts (28.5%), but in a much lower proportion of macrophages (0.9%) of mouse. |